# Live authoring
Building and maintaining tests can be frustrating when you have no control over the execution.
Virtuoso's live authoring fundamentally changes your experience, such that you can:
- ⚡️ Instantly see the result of the action you take in your step;
- ☁️ Have your own dedicated browser in the cloud, ready at your command;
- 💪 Be confident that the step you wrote will work on re-execution;
- ⌚️ Pause and play at any point, such that you can debug at ease;
- ⚙️ Look and investigate deeper using the same functionality as Chrome DevTools;
- 😎 Take control of the browser by interacting with your page at any point;
- and much more!
In a live session, as you add your new steps or change existing ones, they are instantly executed on an interactive browser on the right hand side. Our users tell us that this has made their test authoring and maintenance 10-100x faster, saving them significant time and effort.
# The basics
Whether you are building your journey for the first time, or maintaining an existing one, you would wish to know whether the step you just added or changed works. Live authoring helps you achieve just that.
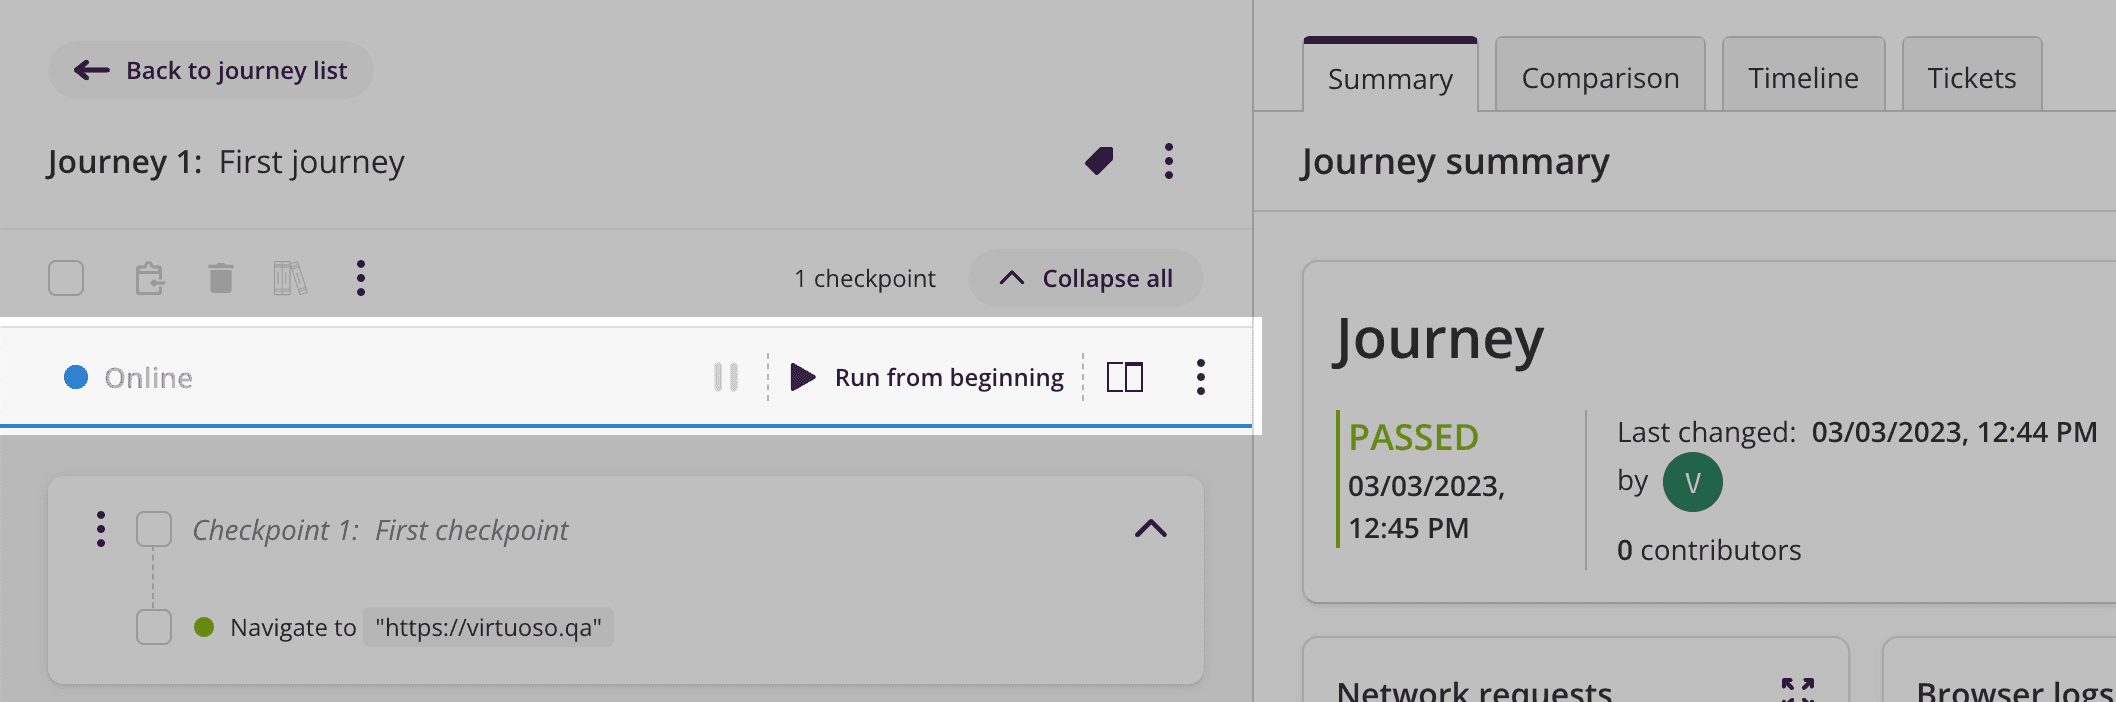
After creating your journey, you will notice the live authoring bar on the left panel, which you can command to run your journey, if Virtuoso already has not done so.
Browser start time
If when you open your goal, your browser has not launched yet, you can start building your journey while it launches.
Once ready, the live session will then follow your journey as you build it.
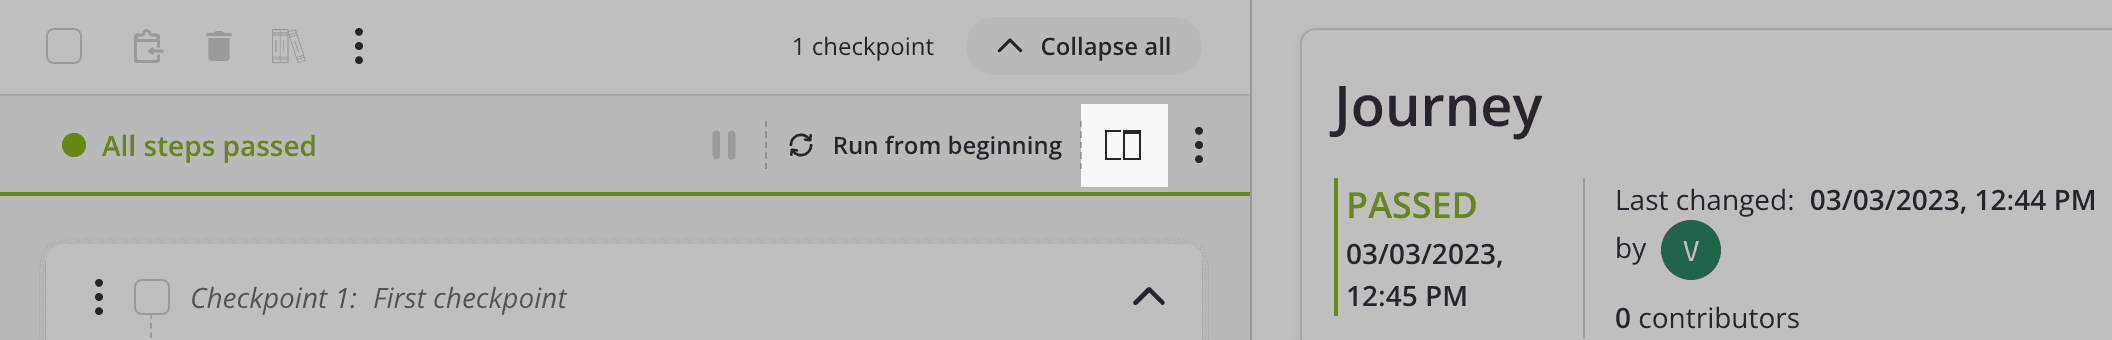
# Interactive preview
Clicking this button opens the interactive preview:
This is a fully-featured headless browser, dedicated to you, at your command. You can interact with it like any other browser.
Now, simply create new steps and see them get executed.
# Creating test steps using the interaction menu
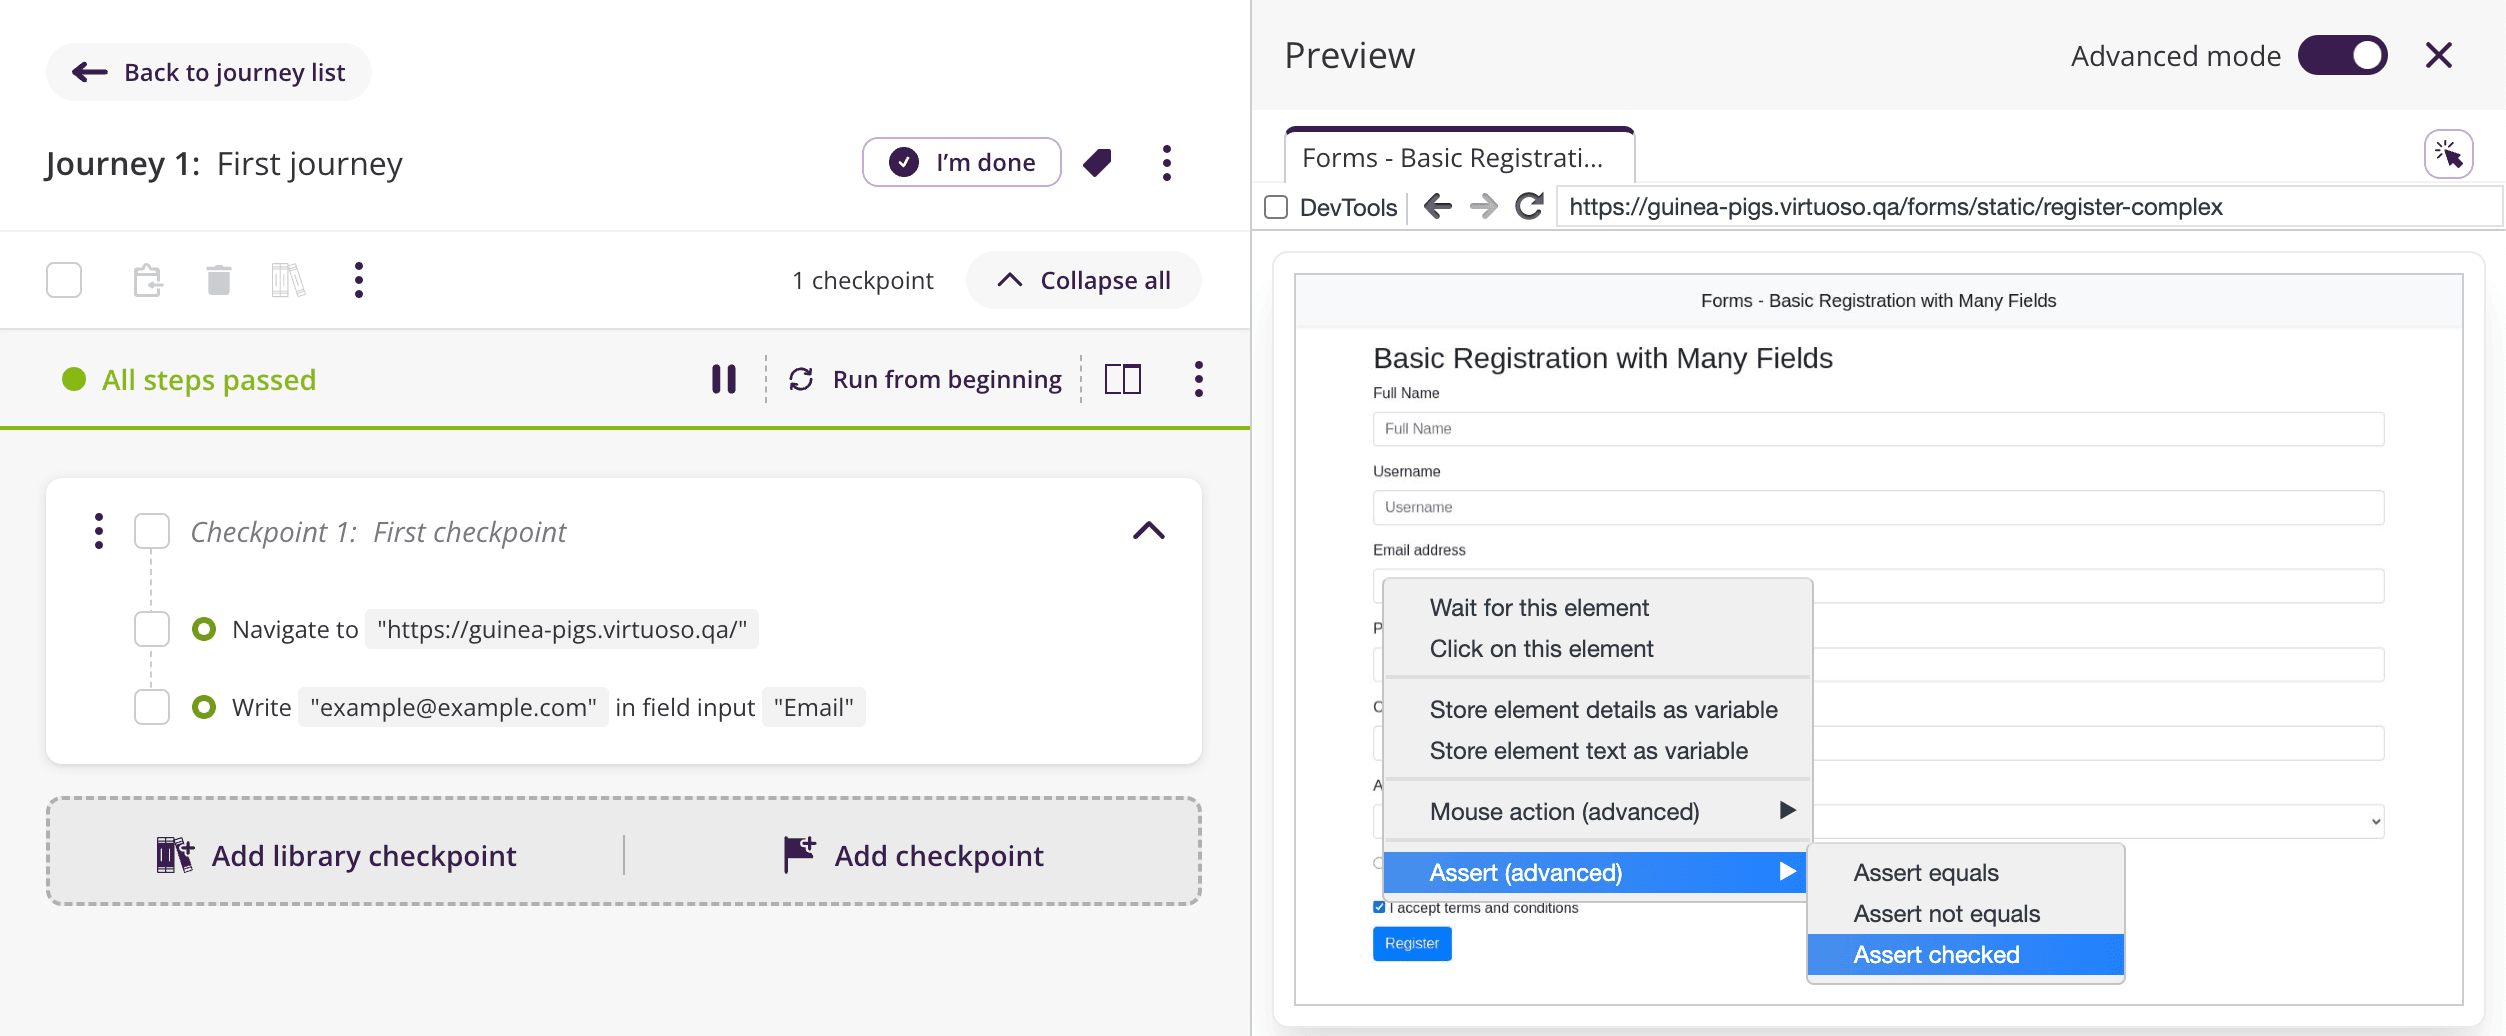
Using your mouse, simply right click on any element on the preview of the application you are testing, to open the live authoring interaction options.
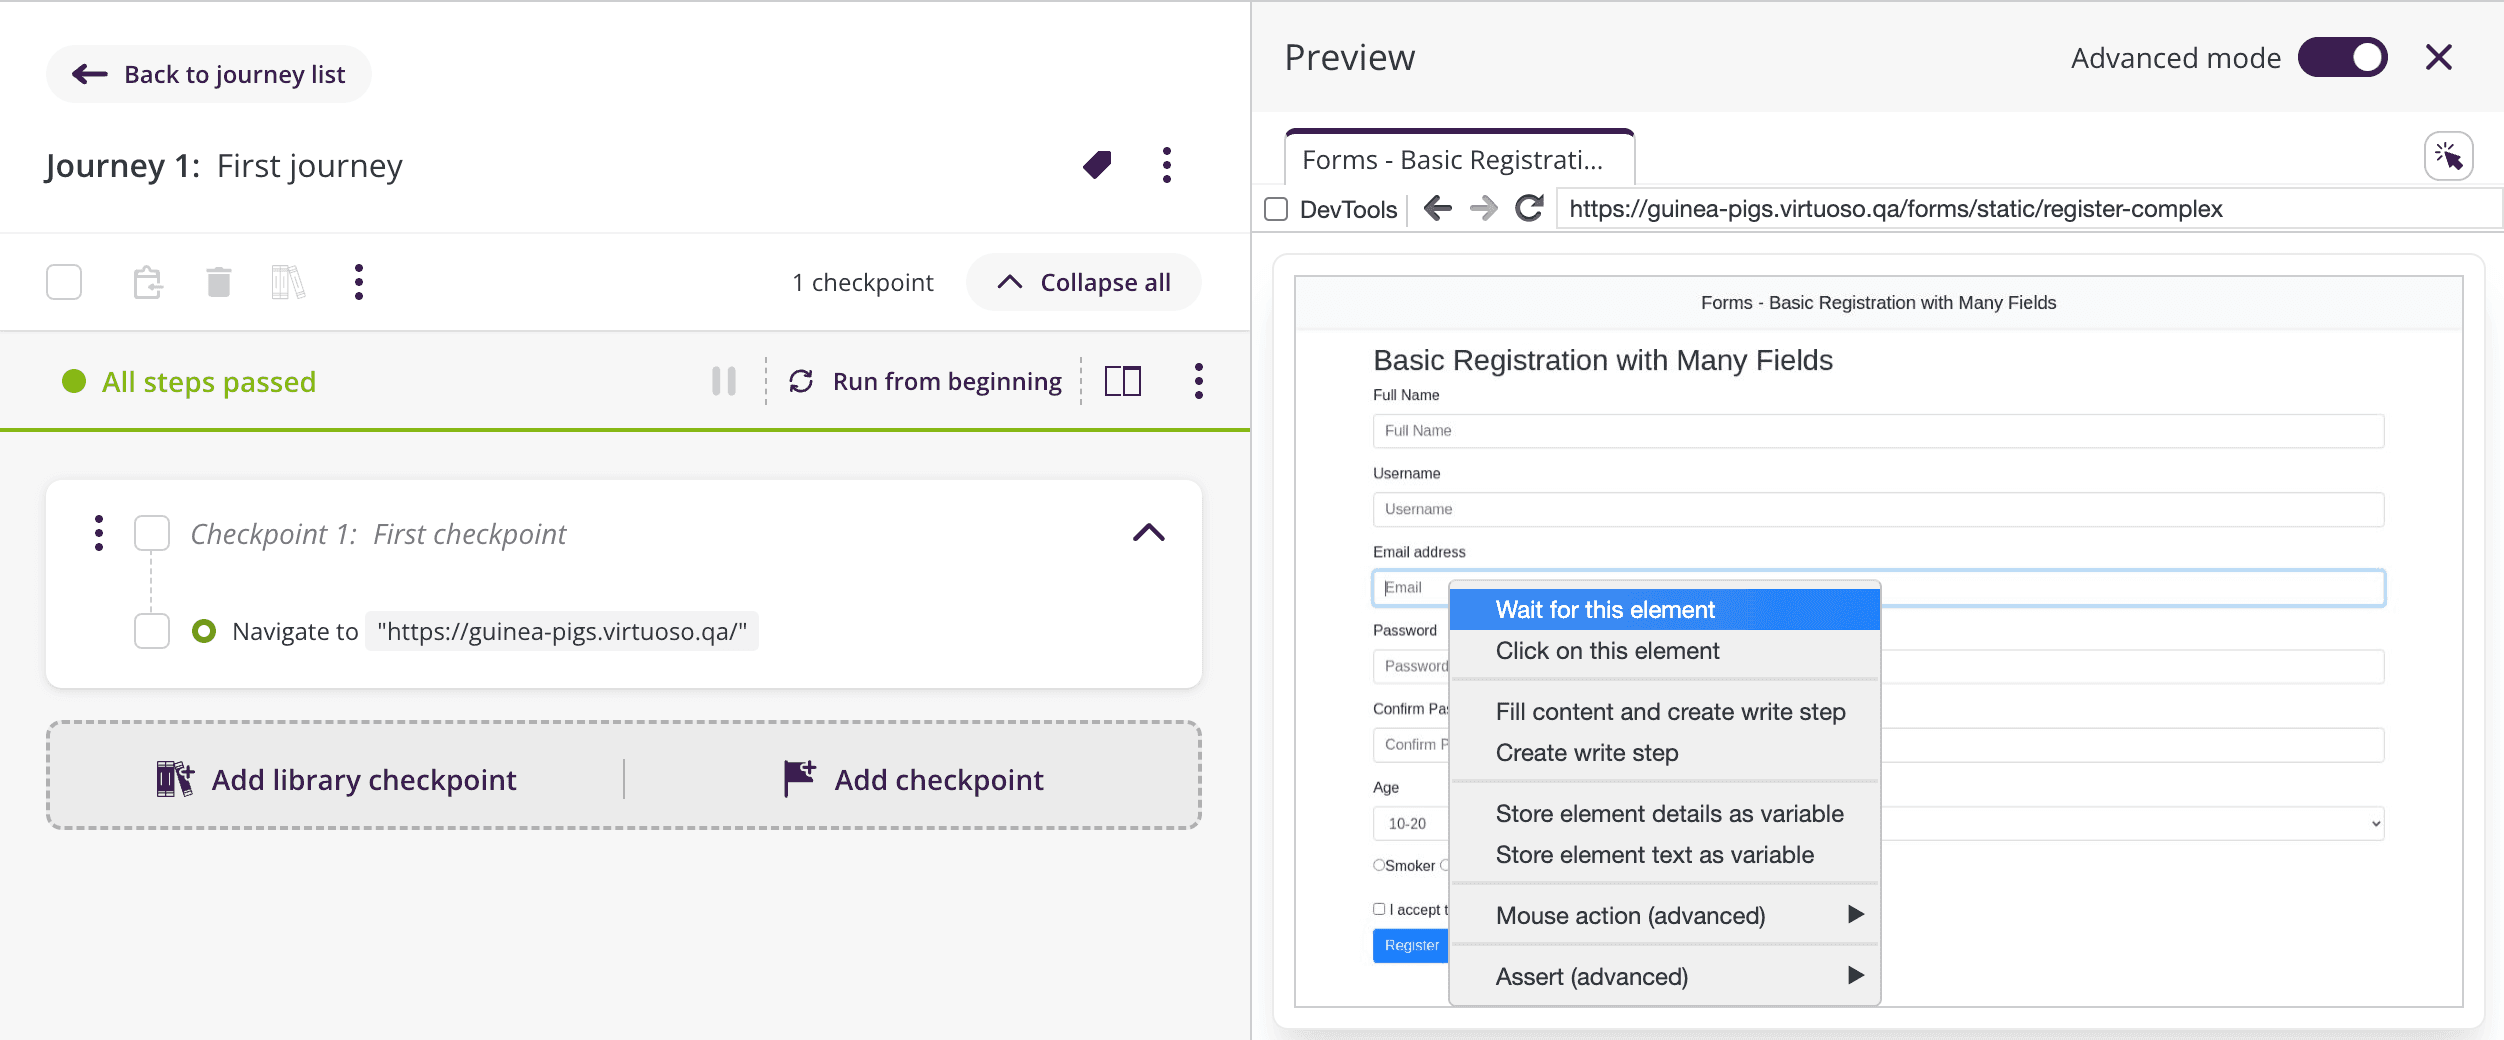
The options shown represent the most common interactions that you usually do by using Virtuoso steps such as wait for an element, fill an input field, assert a checkbox is checked, store element details into a variable among others; with the difference that you are only one click away from capturing that action.
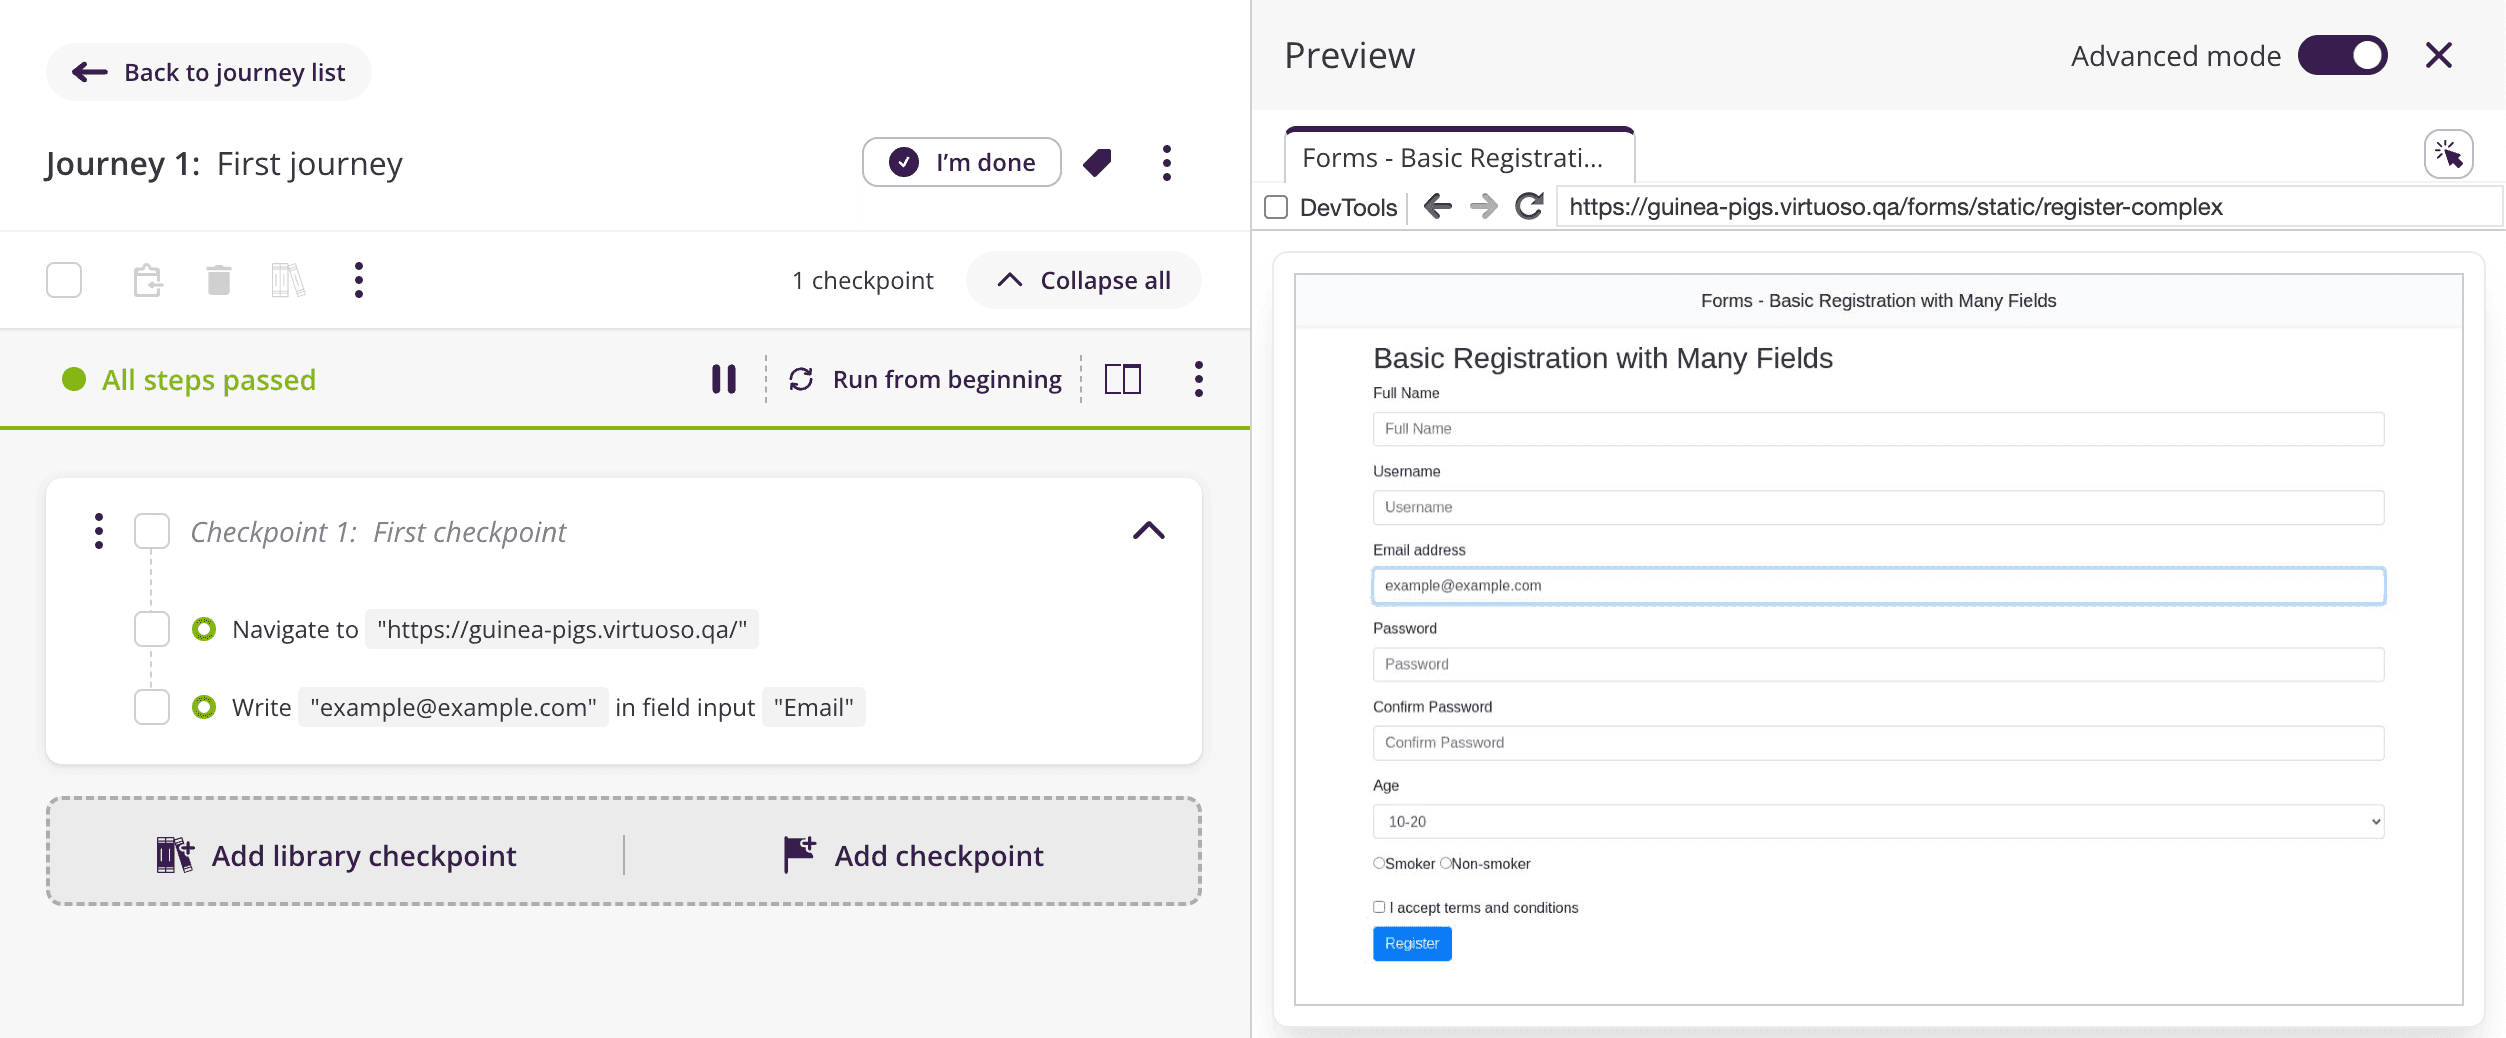
Clicking on an option will create a natural language step targeting the element you are interacting with. Beyond creating different steps, with the interaction menu you can quickly fill forms and input fields by using the option Fill content and create a write step that will try to detect the input type and create a meaningful command for you (e.g., using a test e-mail to fill an e-mail input field).
Or assert that a checkbox field is marked:
When using the options store element details or store element text Virtuoso will ask for the name of the variable that it will use to store the result, just type it and click on Accept or press ENTER (if no name is provided, Virtuoso will use a generic one for it).
# Working with multiple tabs
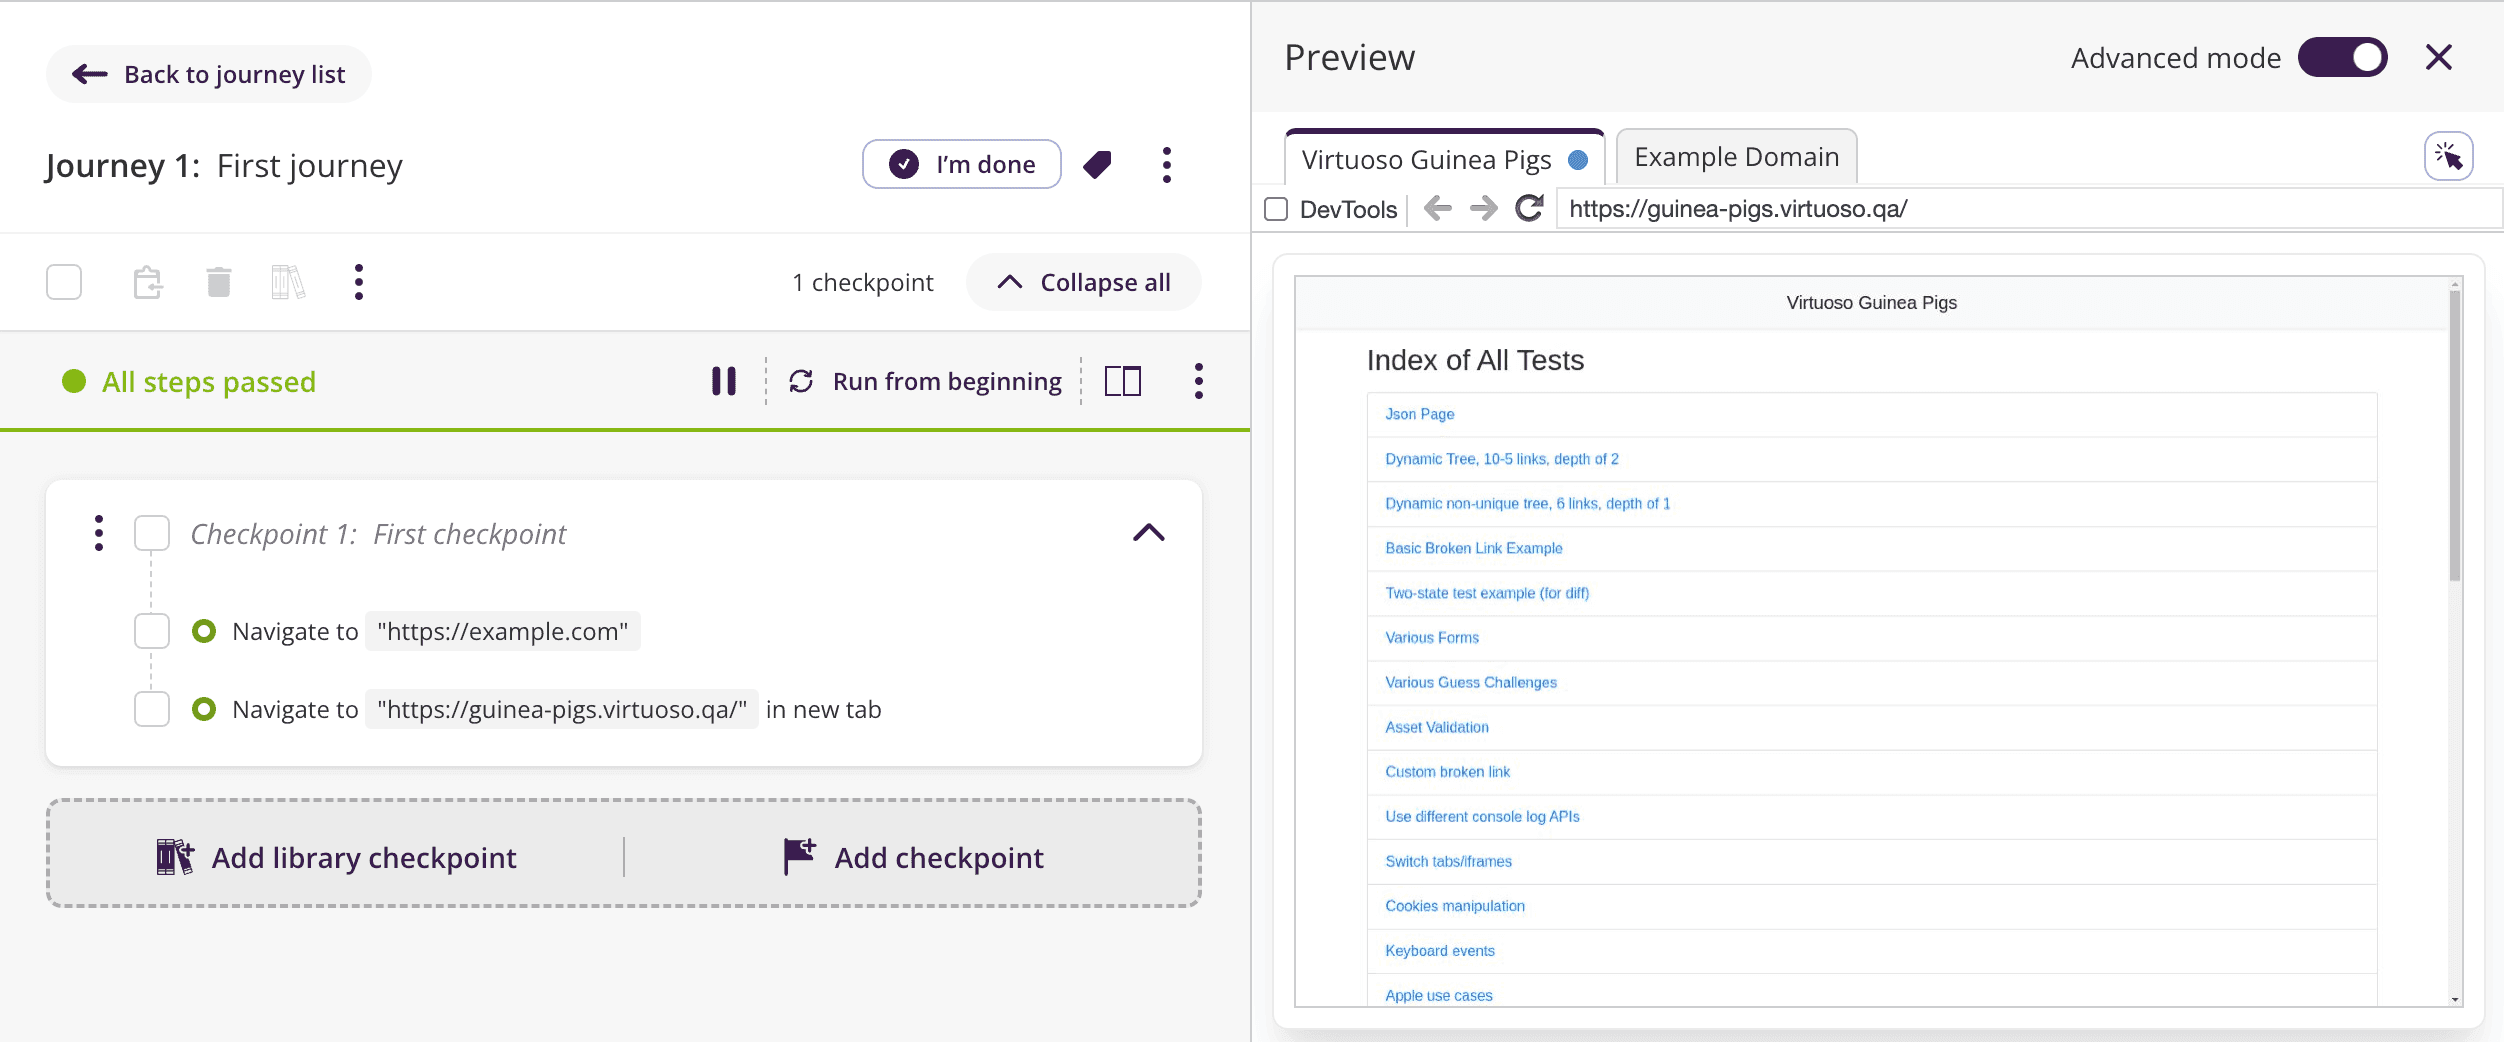
There are cases where your journey might end using more than one tab (e.g., using a command that opens a link in a new tab) and although you can switch from one tab to another to take a look in the interactive preview, Virtuoso will be focused on a single tab at any point on time.
Virtuoso will let you know which tab is the one it's focused on at any time by showing a purple indicator on the active tab:
On a side note, when working with the interaction menu, Virtuoso will include the needed steps to switch to your active tab if Virtuoso was focused in a different tab.
# Fixing steps and elements
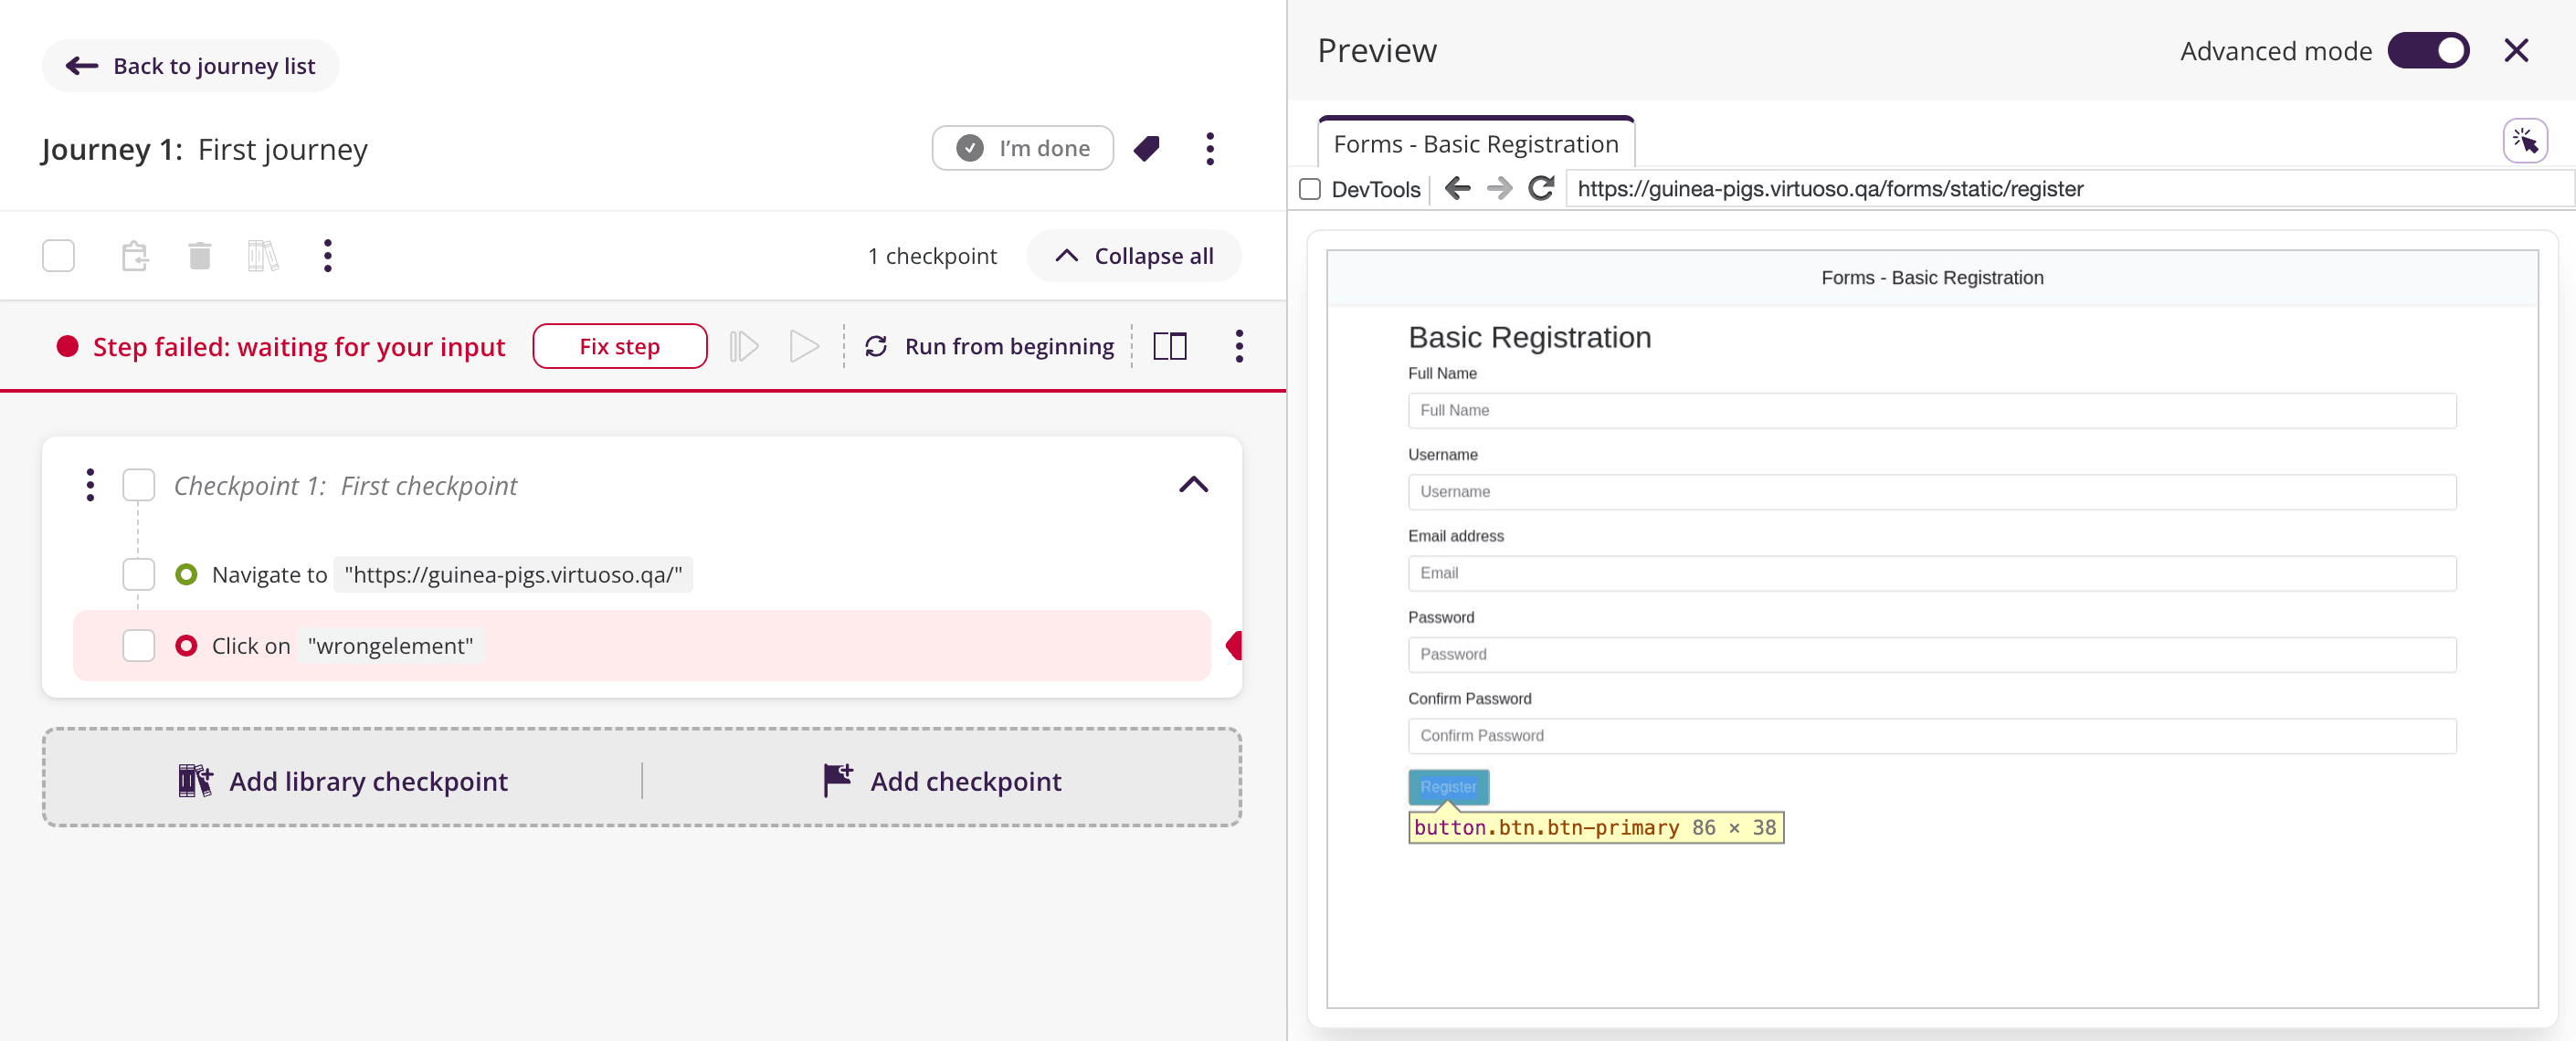
When a step fails, the live browser will halt its execution, and will resume once you change the step.
In the following example, the step fails due to an incorrect target element:
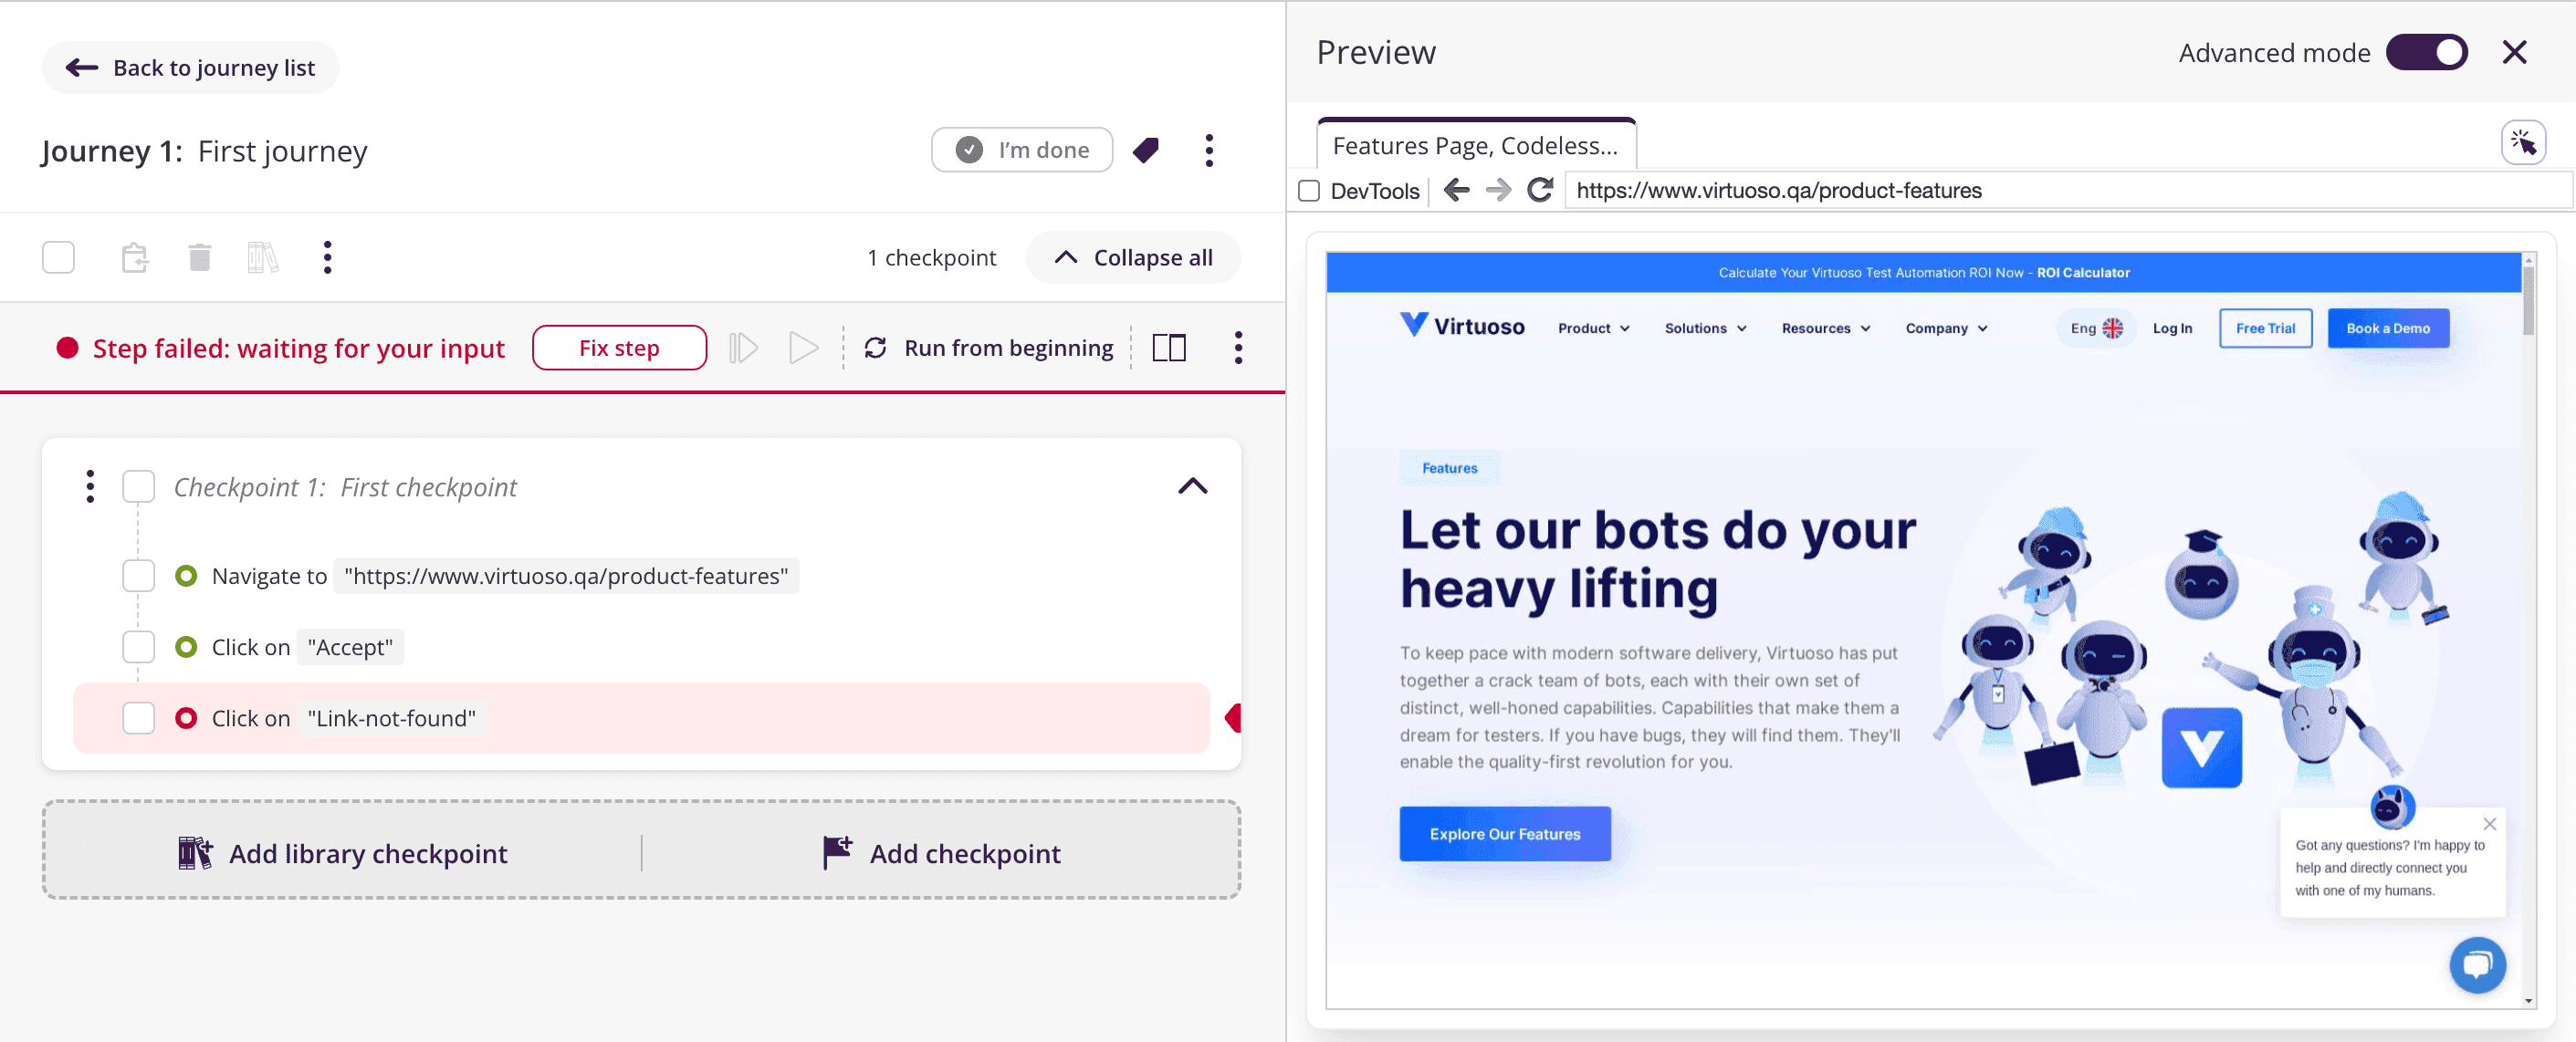
After changing a property of the step via the step editor, the live browser will automatically re-execute the step.
An alternative to fix the step element is to just click on Fix step , mouse over the correct element, and then click on it. Virtuoso will do its best to fix the element details for you:
# Play / pause debugging
During the execution of a journey, you can pause the live browser's execution at any time.
While the live browser is paused, you can use the interactive preview to further examine the browser's state, without it executing additional test steps, or to add/change steps below the currently executed step.
You can also control the execution of the journey in this state, by using the Continue one step button to execute the next step in the journey. This allows you to fully investigate how a test step changes the state of the page that you are testing.
Alternatively, the Continue button will resume the execution of the remaining test steps.
# Adding multiple pause points
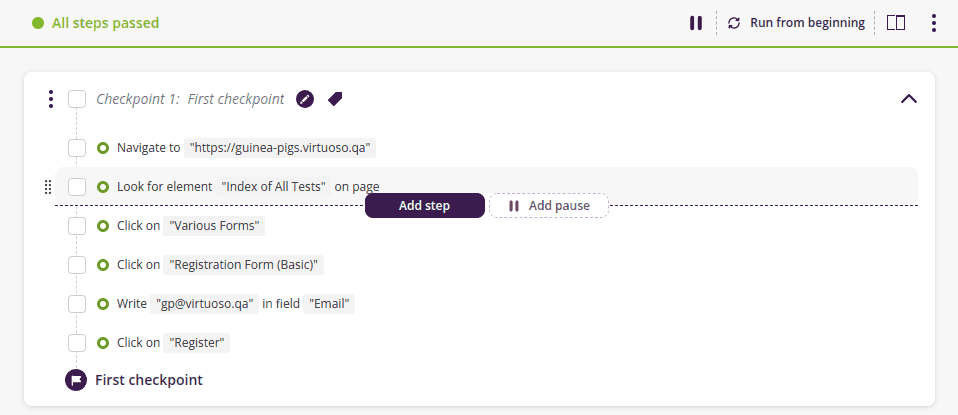
If you need better control over where to pause the execution, or if you need to add more than one pause point, you can do this by hovering over any of the test steps with your mouse and then clicking on Add pause. This will add a pause point to the test step, and the live execution will pause when reaching it.
The behavior of this is exactly the same as using the Pause button described above on each of the steps that have pause points.

Pause points are not lost between executions during the current live authoring session. You can remove a single pause point clicking on Remove pause over the test step with a pause point, or you can remove all at once by clicking on the context menu and then click on Remove all pause points.
On a side note, persisting the execution state will remove all the pause points too.
# Run from here
The natural workflow using Live Authoring is that your steps are executed as you type them, while you see the interactions over your application under test in the Interactive preview. As a tester, you may want to further refine your journey by fine-tuning one or more test steps and re-running them until you are done.
Your journey might include setup-like test steps, such as a checkpoint for just logging into your application. You may wish to skip those steps, and just run from the point that you updated and onwards.
Mouse over the test step that you wish to start from, and click on Run from here. Virtuoso will mark all the previous steps in a gray color, meaning they are skipped. Virtuoso will then start to run the steps where you clicked on Run from here and onwards, including the starting test step itself.
For a better understanding of how this functionality works -- and how it can help you while test authoring -- here is an example of a real use case:
- Your journey navigates to your application, does a couple of interactions in order to reach a registration form, and then fills the inputs of a form;
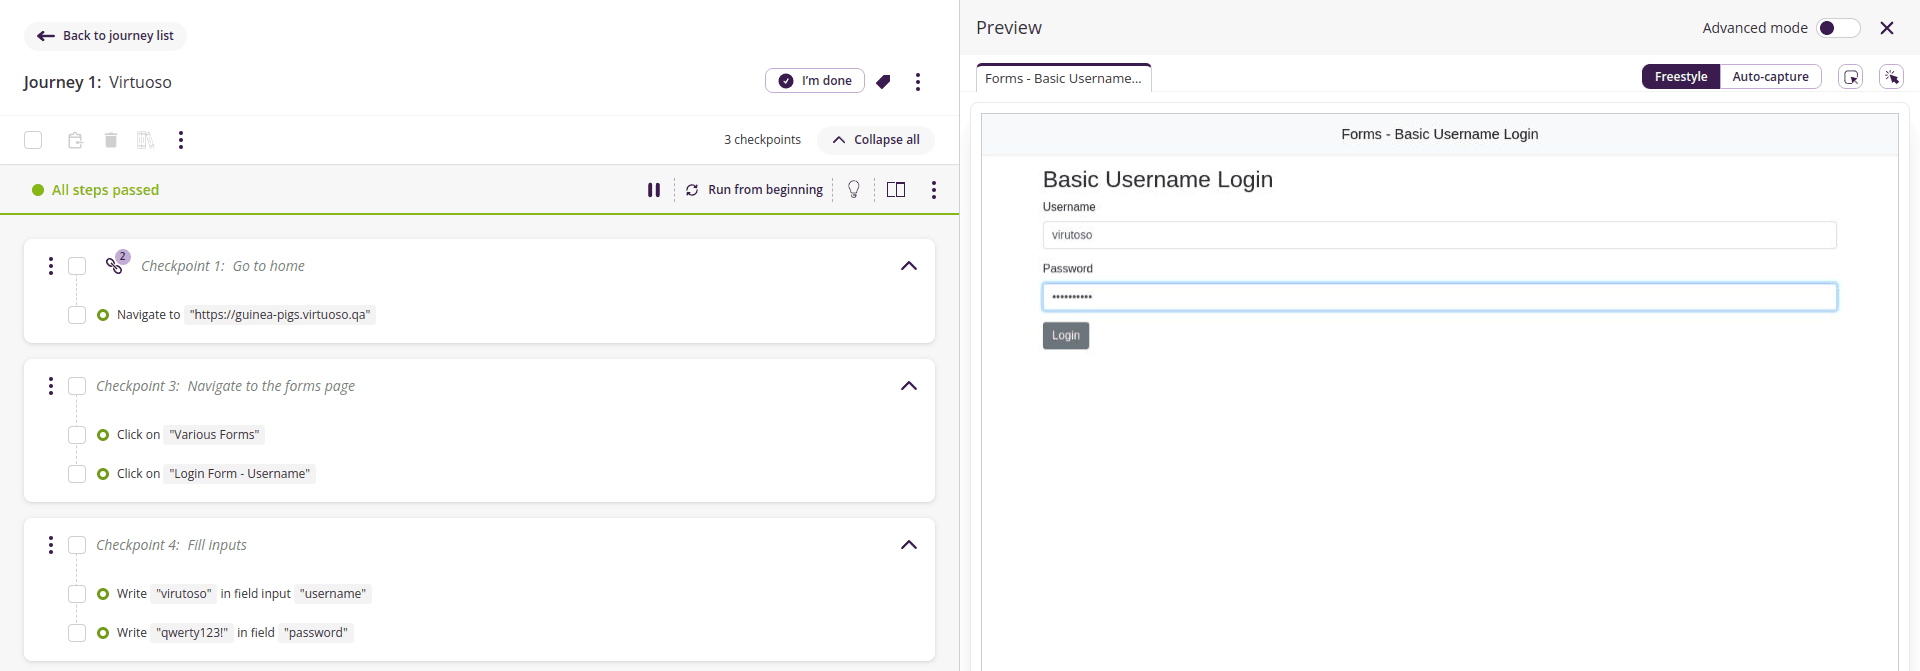
- By this point, you realize that there is a typo in one of your test steps; it says
virutosowhere it should sayvirtuoso, so you update your test step. At this point, you may useRun from beginning(running the whole journey again), or, given that the application is already in the forms page, just re-run the test steps that are meant to fill the inputs by clicking inRun from here;

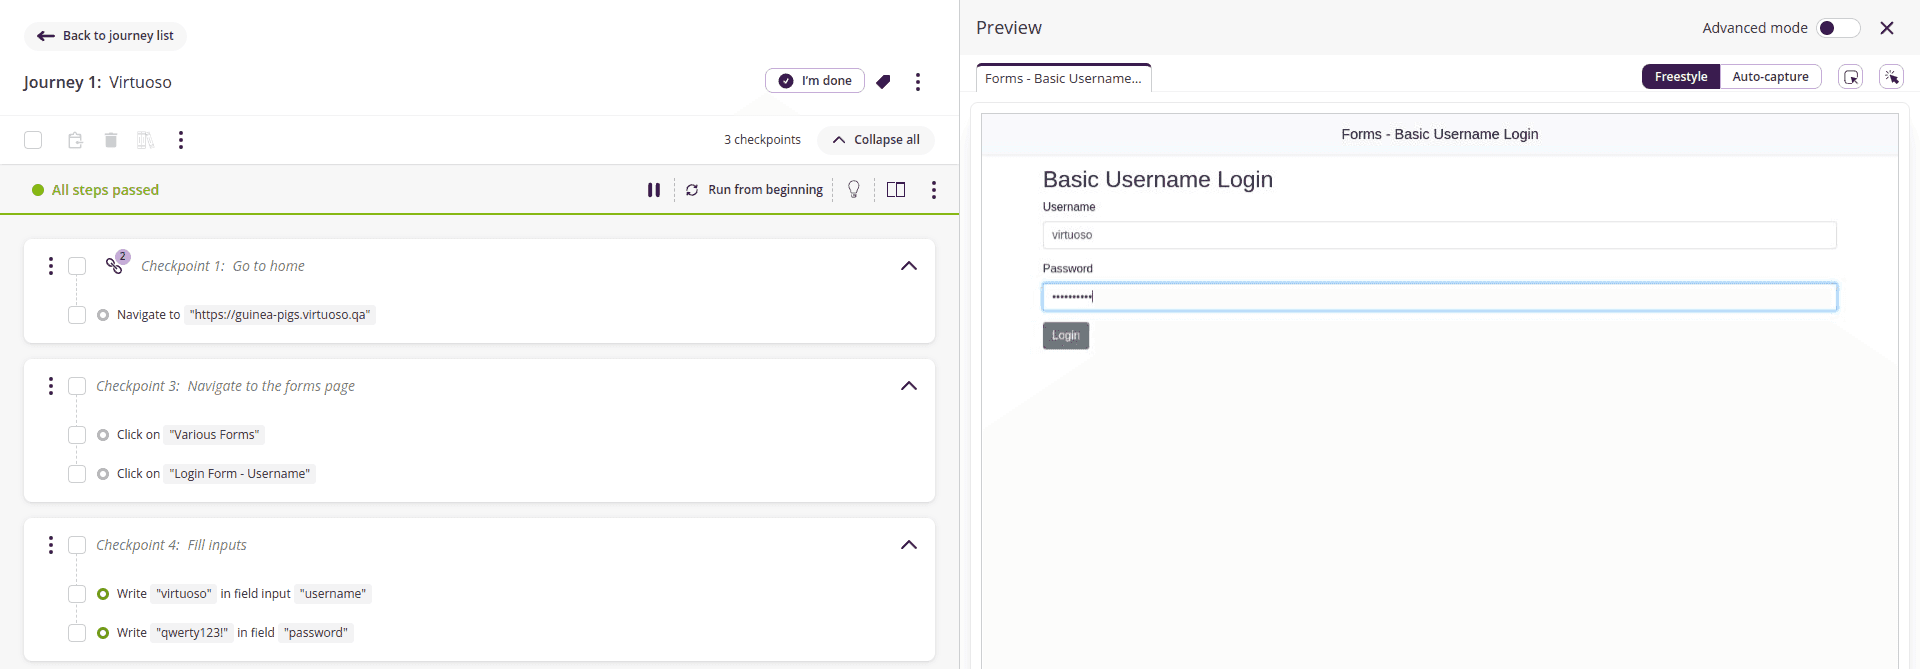
- Virtuoso runs your test steps again starting from the test step that you updated (those marked as green), skipping all the previous test steps (those marked as gray).
Application state
When running from a custom starting point by using Run from here, Virtuoso will assume your application is in a valid state to run your test steps. By looking at the Interactive preview, you can verify the state of your application at any point of your live session;
Remember that you can interact with the Interactive preview as it's an actual browser (e.g., to put your application in the desired state in order to run your checkpoint once again).
Use of variables
The current values of variables are not changed when using Run from here; any variable values that were set elsewhere in the journey will be kept.
Furthermore, if you changed variables outside of the journey (e.g., in a data table or environment) since you last used Run from beginning or started Live Authoring, these external variable changes will not be applied when using Run from here. If you need external variable changes, use Run from beginning instead.
# Live bot tracking
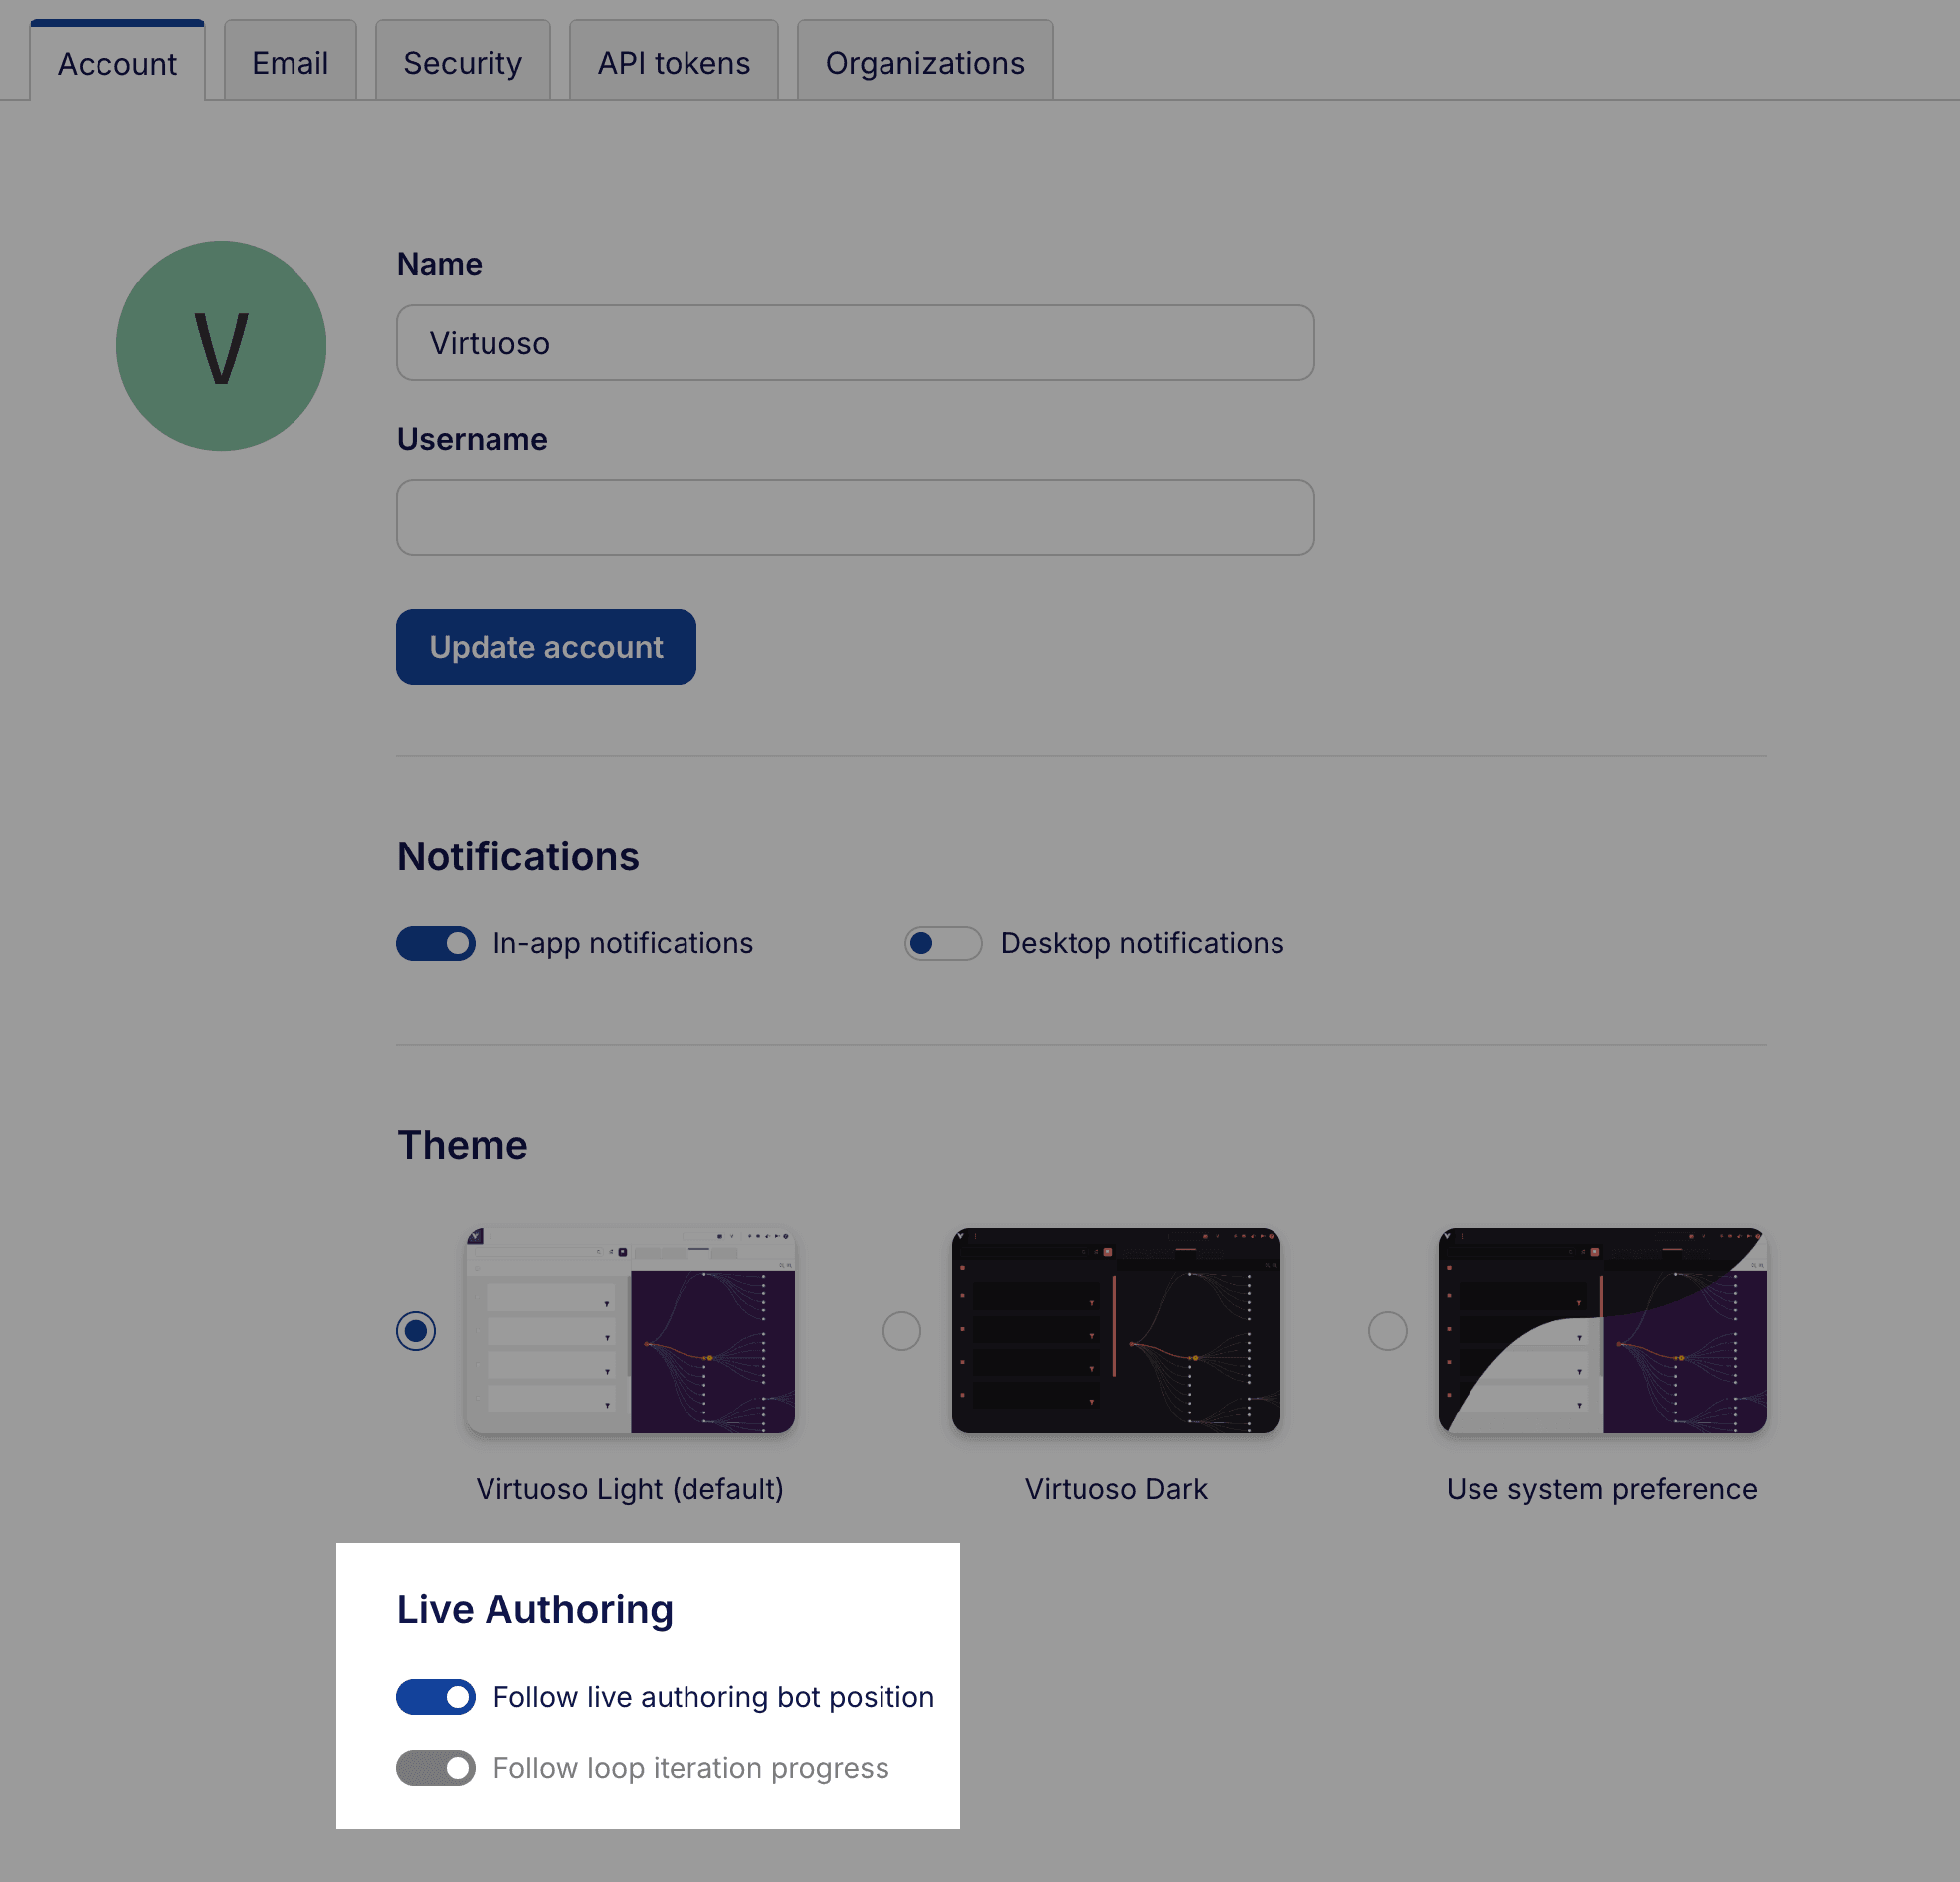
Live bot tracking automatically follows your journey's execution progress, keeping the interface focused on the currently active step. This feature makes it easier to monitor test execution in real-time, especially for journeys with many steps or loop iterations.
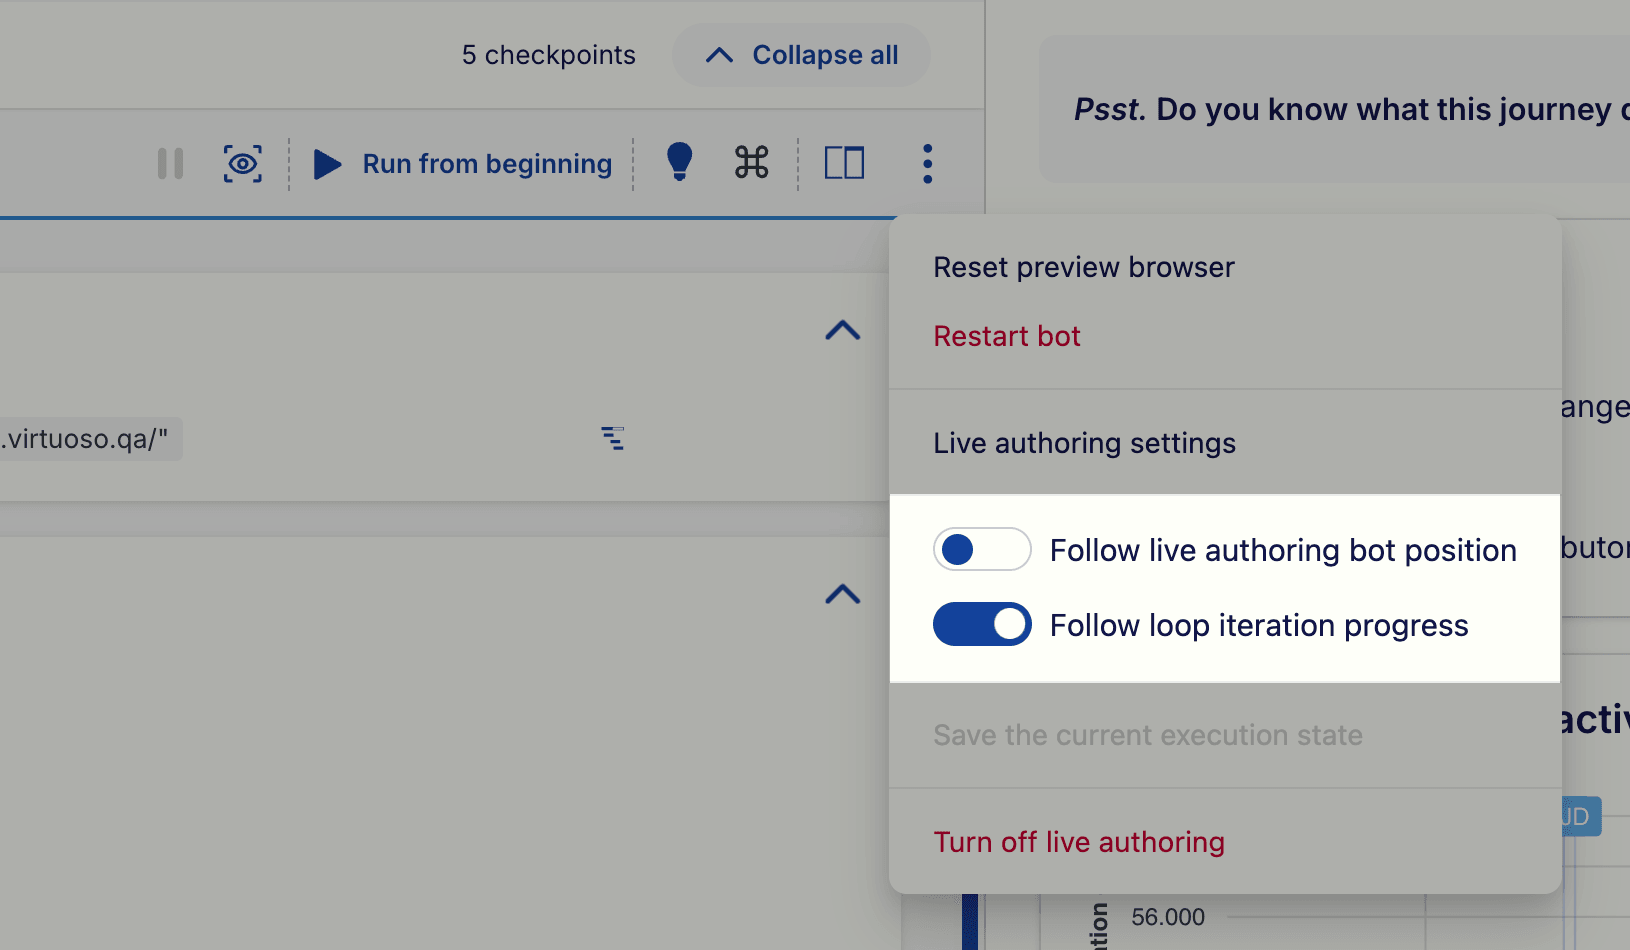
Virtuoso offers two tracking options:
- Follow loop iteration progress: Automatically switches to the active checkpoint loop iteration tab (1/10, 2/10, etc.) and keeps the view focused on the current step within that iteration.
- Follow live authoring bot position: Provides comprehensive tracking by following your bot's current position during the entire journey execution, automatically scrolling to and highlighting the active step in real-time. This option includes loop iteration tracking as well.
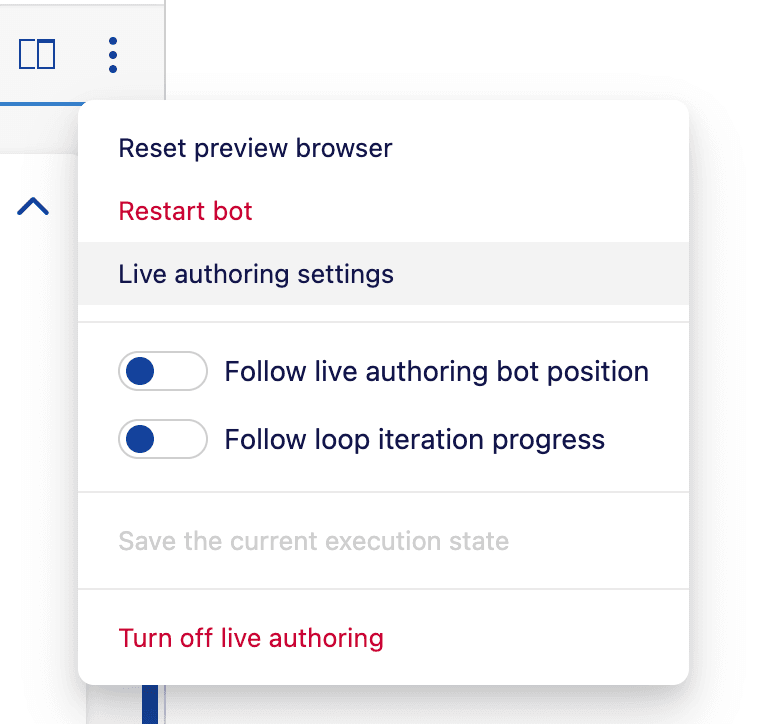
You can configure tracking preferences through the live authoring context menu or in your user profile settings:
Live authoring context menu
User profile settings
If you need to temporarily pause tracking to examine a specific step while execution continues, use the pause button in the live authoring toolbar:

Live bot tracking improves visibility during journey execution, helping you stay focused on the active parts of your test without needing to manually scroll or switch between loop iterations.
# Finish editing a live execution
All the executions you perform using live authoring are only on your personal browser in the cloud. However, once you are done with building or maintaining a journey, you may wish to persist the status of the journey, as well as the screenshots, etc. as an execution report to communicate with your colleagues. This can be achieved by selecting the Save the current execution state option from the More live authoring context menu.

This will create an execution record of your journey, which you can find in "Project Activity", labeled as built live.
If you interacted with the journey (e.g. by pausing, adding a step, etc.) before the last live execution finished, Virtuoso will automatically start a validation execution when you click "Save the current execution state". The "Validating..." status on the live authoring bar lets you know when a validation execution is running. This ensures that the result of the execution would be a true end-to-end execution of your tests (e.g., to rule out any element timing issues).

# Advanced mode and DevTools
This toggle in the interactive preview enables advanced mode:
Advanced mode provides you deeper access to the browser, such as: developer tools (as you are familiar with in DevTools), URL bar, back/forward button, etc.
WARNING
Advanced mode uses considerably more bandwidth than the regular live authoring preview. We recommend only using advanced mode when necessary for the best live authoring experience, especially for users with slower internet connections.
You can use the same capabilities as you find in DevTools (opens new window) to debug problems that you may encounter while testing.
For example, inspect elements, network traffic, console logs and errors, monitor the page memory and performance, etc. Let's look at some of these in the sections below.
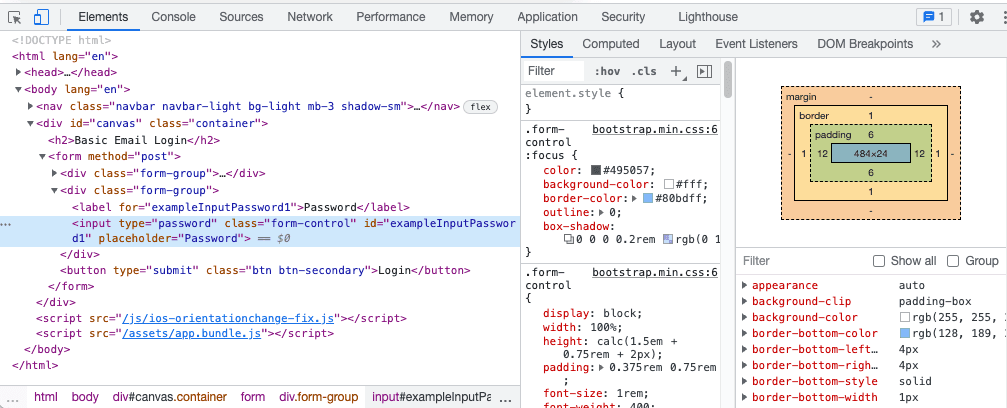
# Element inspector
The Elements tab provides a view of the page's HTML. Here are some common use-cases:
- Hover individual HTML elements to highlight them in the interactive preview.
- Select an element to view its properties, such as its styling.
- Right click an element and copy its XPath or CSS Selector.
- Figure out attributes of elements (to use as hints), or whether your element lives in an iframe.
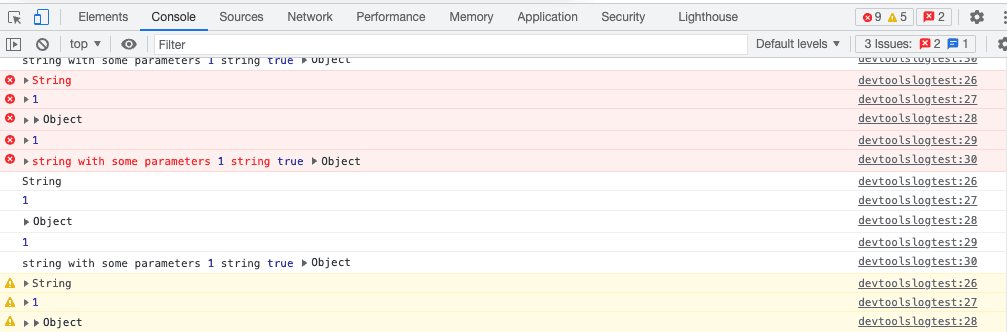
# JavaScript console & source viewer
The Console tab provides a fully-fledged JavaScript console. With this you can:
- Look at any console logs or errors thrown by the application, and investigate them further.
- Manually execute JavaScript code or call out functions, which can be particularly useful for building expressions and extensions.
- Inspect the value of any current JavaScript variables in the browser.
The Sources tab allows you to view the JavaScript sources loaded by your page. Using this you can:
- View the code running on the browser, at that specific point.
- Set breakpoints, by clicking on the line number of any line of code, such that when the browser reaches that line of code, it pauses at this location, allowing you to further debug the script in its current state.
# Network monitoring
The Network tab allows you to monitor and control network requests made and received by the browser. For example, you can:
- View API calls made by the page by clicking Fetch/XHR, and then selecting an individual request displays its information, such as the request's headers, payload, and the response that the browser received.
- Investigate resources loaded on the page, the timing of the requests, etc. which can also help reveal potential bottlenecks in your application.
# Limitations and differences
Virtuoso's browser runs in a headless manner, and as such, a number of a differences exist with normal user browsers which you should be aware of:
- Native elements such as dropdowns, datepicker, color picker, etc. which are developed by the browser vendors are not shown to users, because they render on a different layer of the browser. This however does not stop you from testing the application itself.
- Tip: use normal Virtuoso steps such as
pick,write, andpressto interact with the inputs.
- Tip: use normal Virtuoso steps such as
- Native error pages such as "This site can't be reached" are not shown.
- Tip: use the network tab in the DevTools to see why the document request failed.
- File inputs which you can click to upload files will not open a local file browser.
- Tip: use the
uploadcommand to upload files using these inputs.
- Tip: use the
Additionally, the live preview has a number of differences with normal executions which you should be aware of:
- Native alerts are automatically dismissed when the preview is open, so your
dismisssteps following them would not work. Note that Chromium team discourage use of JavaScript dialogs (opens new window).- Tip: close the preview screen before an alert would be shown, and Virtuoso will execute your tests normally. You can re-open the preview after the step that dismisses the alert has been executed.
Live preview works best on Google Chrome, Chromium, or Microsoft Edge. Although Firefox is also supported, you may encounter occasional issues; and the Safari browser is not supported.
# Tips and considerations
# Step deletion
If you delete a step, Virtuoso will prompt you to re-execute the journey from the beginning, since the current state of the live browser may not be reproducible otherwise.
This can be performed by clicking Run from the beginning:

# Your own dedicated browser
Given that your browser session is dedicated to you only, if you start executing one journey, and then navigate to another journey, you will see the message "Busy on another journey":

You can choose Go to journey to view the journey that your browser session is currently running on. Alternatively, select Run this journey to move your browser to execute the journey you are seeing.
Tabs from a previous journey
What you see in the preview panel is always the view from your own dedicated live-authoring-browser. This means that:
- no other user will be seeing the content of your live authoring browser (nor can you share your browser),
- tabs and the live preview that you see always represents the current state of your browser; not necessarily the tabs from the journey that appears on the left.
# Sensitive variables
While the values of variables marked as sensitive are redacted from the step side effects, note that these sensitive values are not meant to be secure. For example, they will be accessible in the interactive preview.
# The live preview shows "Paused in debugger"
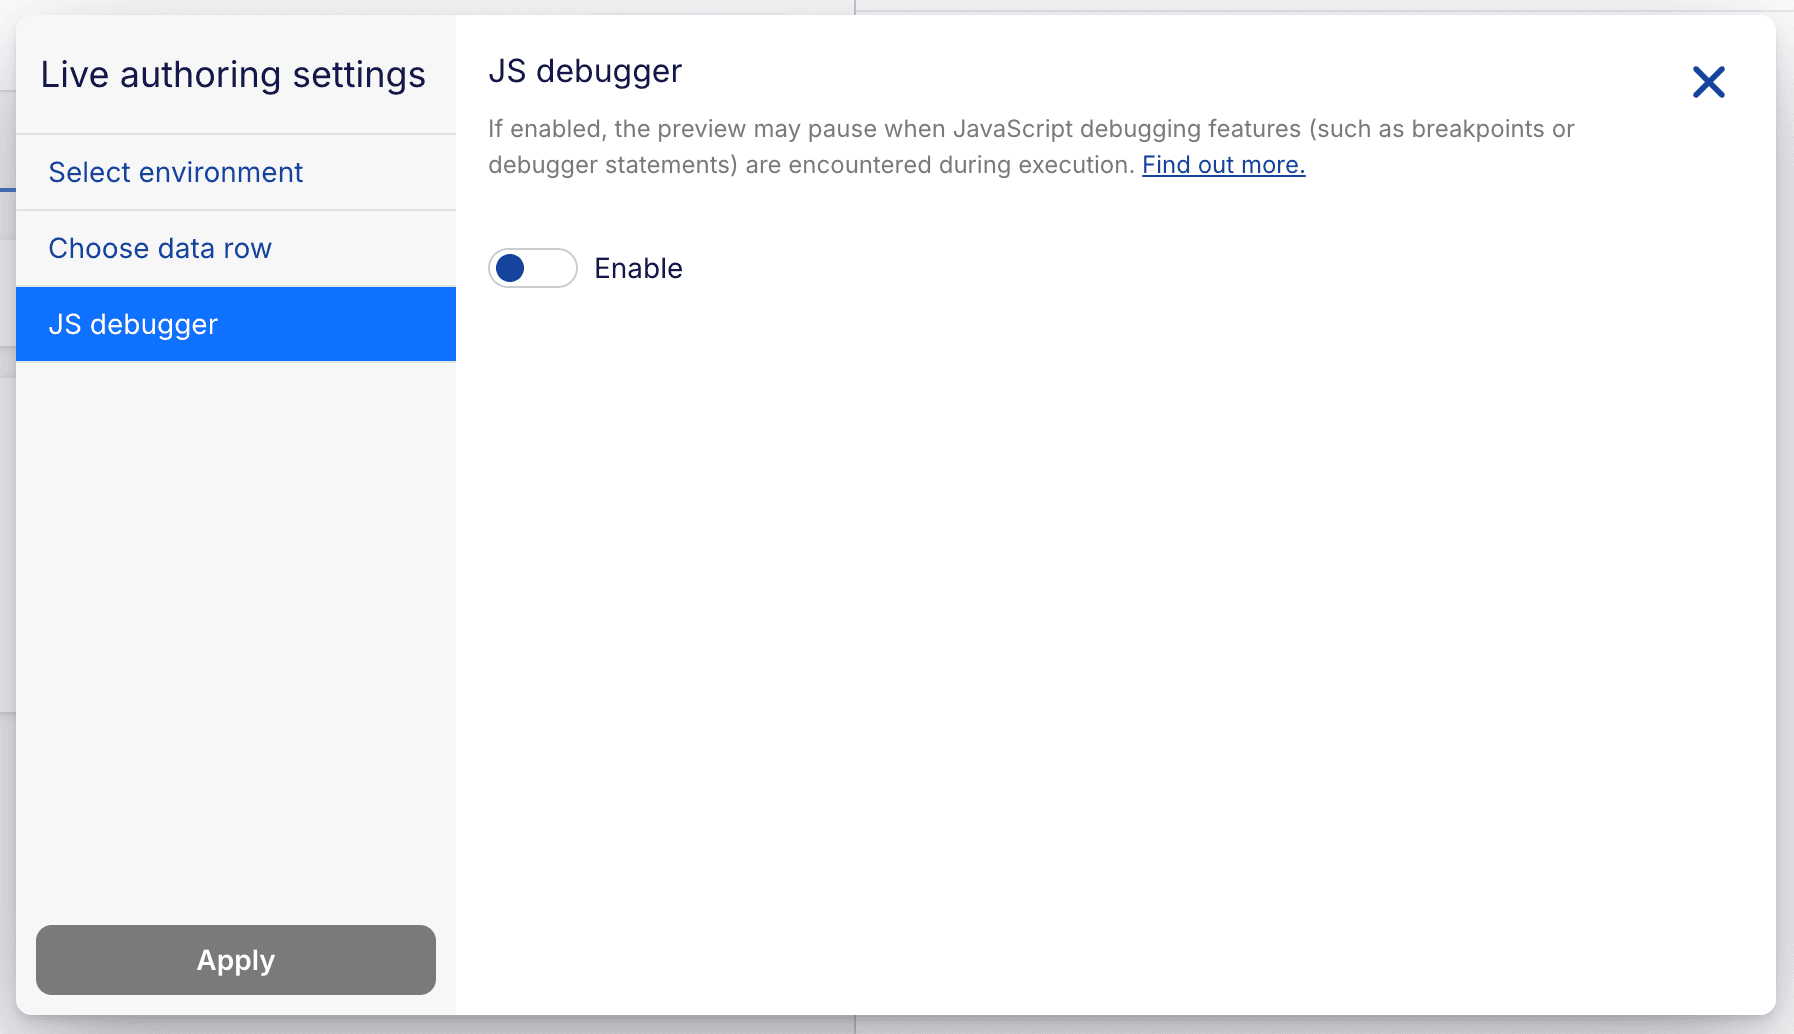
When an application includes JavaScript debugger (opens new window) statements on its code, execution may pause when one of those statements is reached, causing the live preview to appear paused.

While this behavior is disabled by default, you can change this by clicking on the context menu, then clicking on Live authoring settings, selecting JS debugger in the left sidebar, and then switching the Enable toggle.
Avoid using debugger statements on production applications
Although JavaScript debugger is useful when developing an application, it should never be used on a live application. Our suggestion is to always try to remove these statements from your application and only use this workaround when there is no other way.
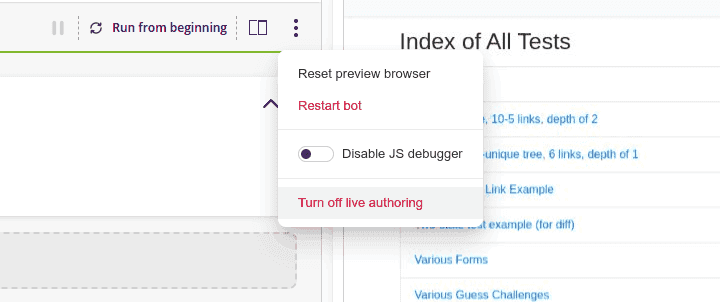
# Temporary turning off live authoring for your user
If you want to temporarily opt-out of the live authoring feature, you can click on the live authoring context menu and then click Turn off live authoring. The feature will not run again on your browser until you turn it on again by clicking on the button Start live authoring shown when the feature is off.
# Environment variables
Live authoring makes use of the environment's values. If a goal has a default one set, that environment will be used first. If it is not set, the project's default environment is used.
Read more about Environments.
# Selecting a custom environment
With live authoring, you can select a custom environment for the current session lifetime without affecting the goal or the project setting.
In order to change it, click on the More menu icon and then Live authoring settings:

Select the desired environment from the list and confirm with Apply:
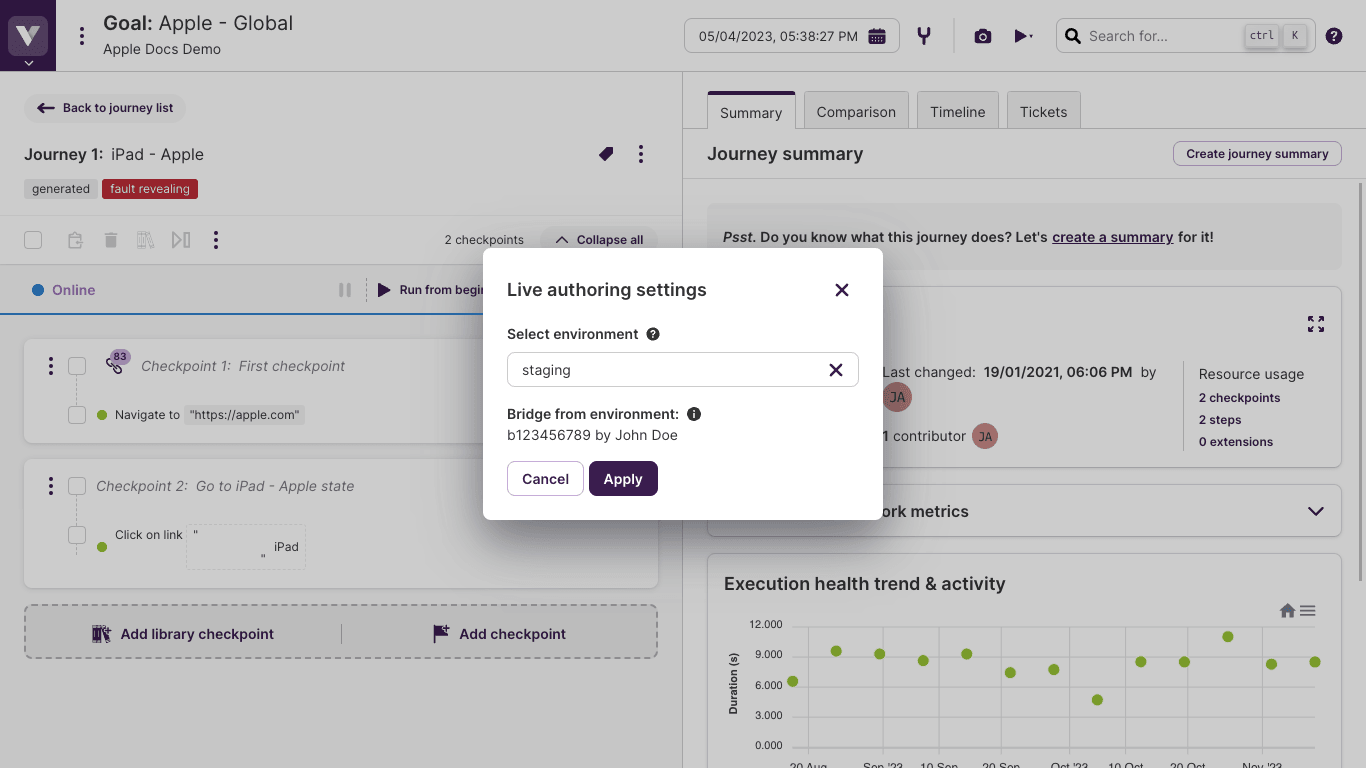
From now on, the selected environment will be used for the current live authoring session. The environment icon tooltip will indicate the current choice:

Environment bridge
If the selected environment has an associated bridge, it will also be used for the current live authoring session.
# Using different test data rows with live authoring
If your journey has a test data table attached to it (see Using test data in a journey), live authoring will, by default, take the values from the first row of the table. However, you might wish to run your journey several times using a different row each time.
To do this, click on the More menu icon and then select Live authoring settings. Now, click on Choose data row and it will display all the available rows. Choose the one that you would like to use and click on Apply.
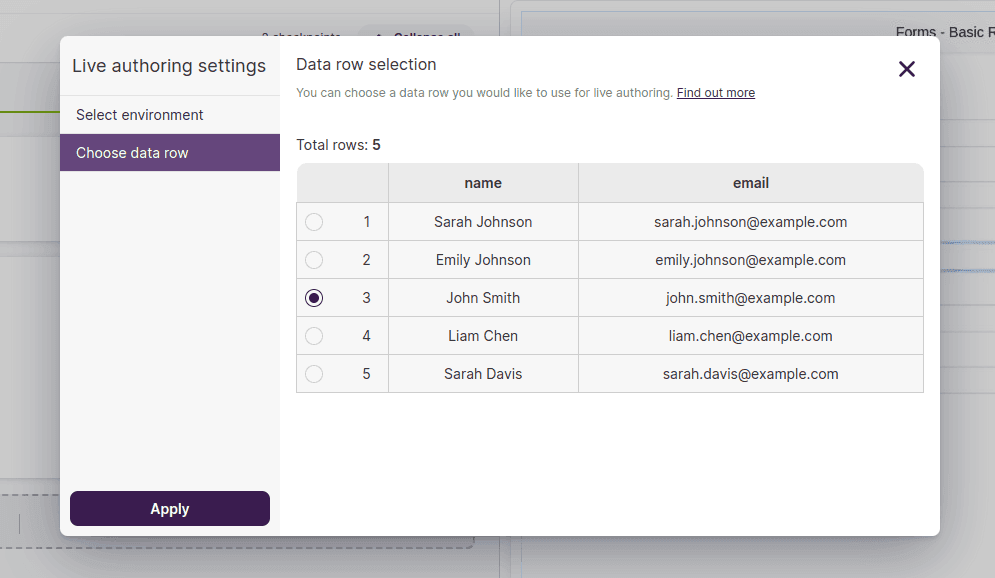
Throughout the lifetime of your live authoring session, it will use the selected row from that point onwards. To switch to a different row, simply choose another one following the same process described earlier, and then click on Run from Beginning or Run from Here.
# StepIQ
While building your journey, StepIQ will suggest steps that you can use to interact with your application. These suggestions are based on the state of the application and the actions you have taken so far.
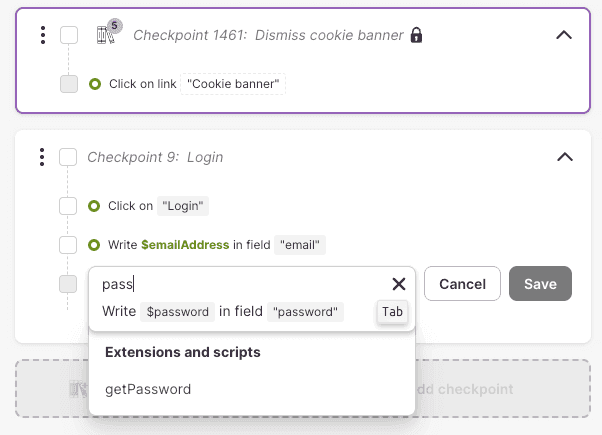
Click the suggested step to bring it into the step editor. This allows you to review and modify the step before adding it to your journey. Once you are happy with the step, click Save to add it to your journey. You can also use keyboard shortcuts to accelerate your workflow: Tab to accept the suggestion, then Enter to save.
Tips for using StepIQ
- To get better suggestions, make sure that Live Authoring is enabled and the interactive preview is open.
- Make sure that the interactive preview is in sync with the journey you are building. If you are adding a step in the middle of the journey, try to add a pause point before it to ensure the interactive preview is in the correct state.
- Use descriptive journey and checkpoint titles.
- Use descriptive variable names and data table column names.
- If you are using extensions, make sure they have descriptive names.
Limitations
- StepIQ cannot suggest API call steps at the moment.
- Some suggestions may not be valid; in this case, they will be highlighted with a red underline.
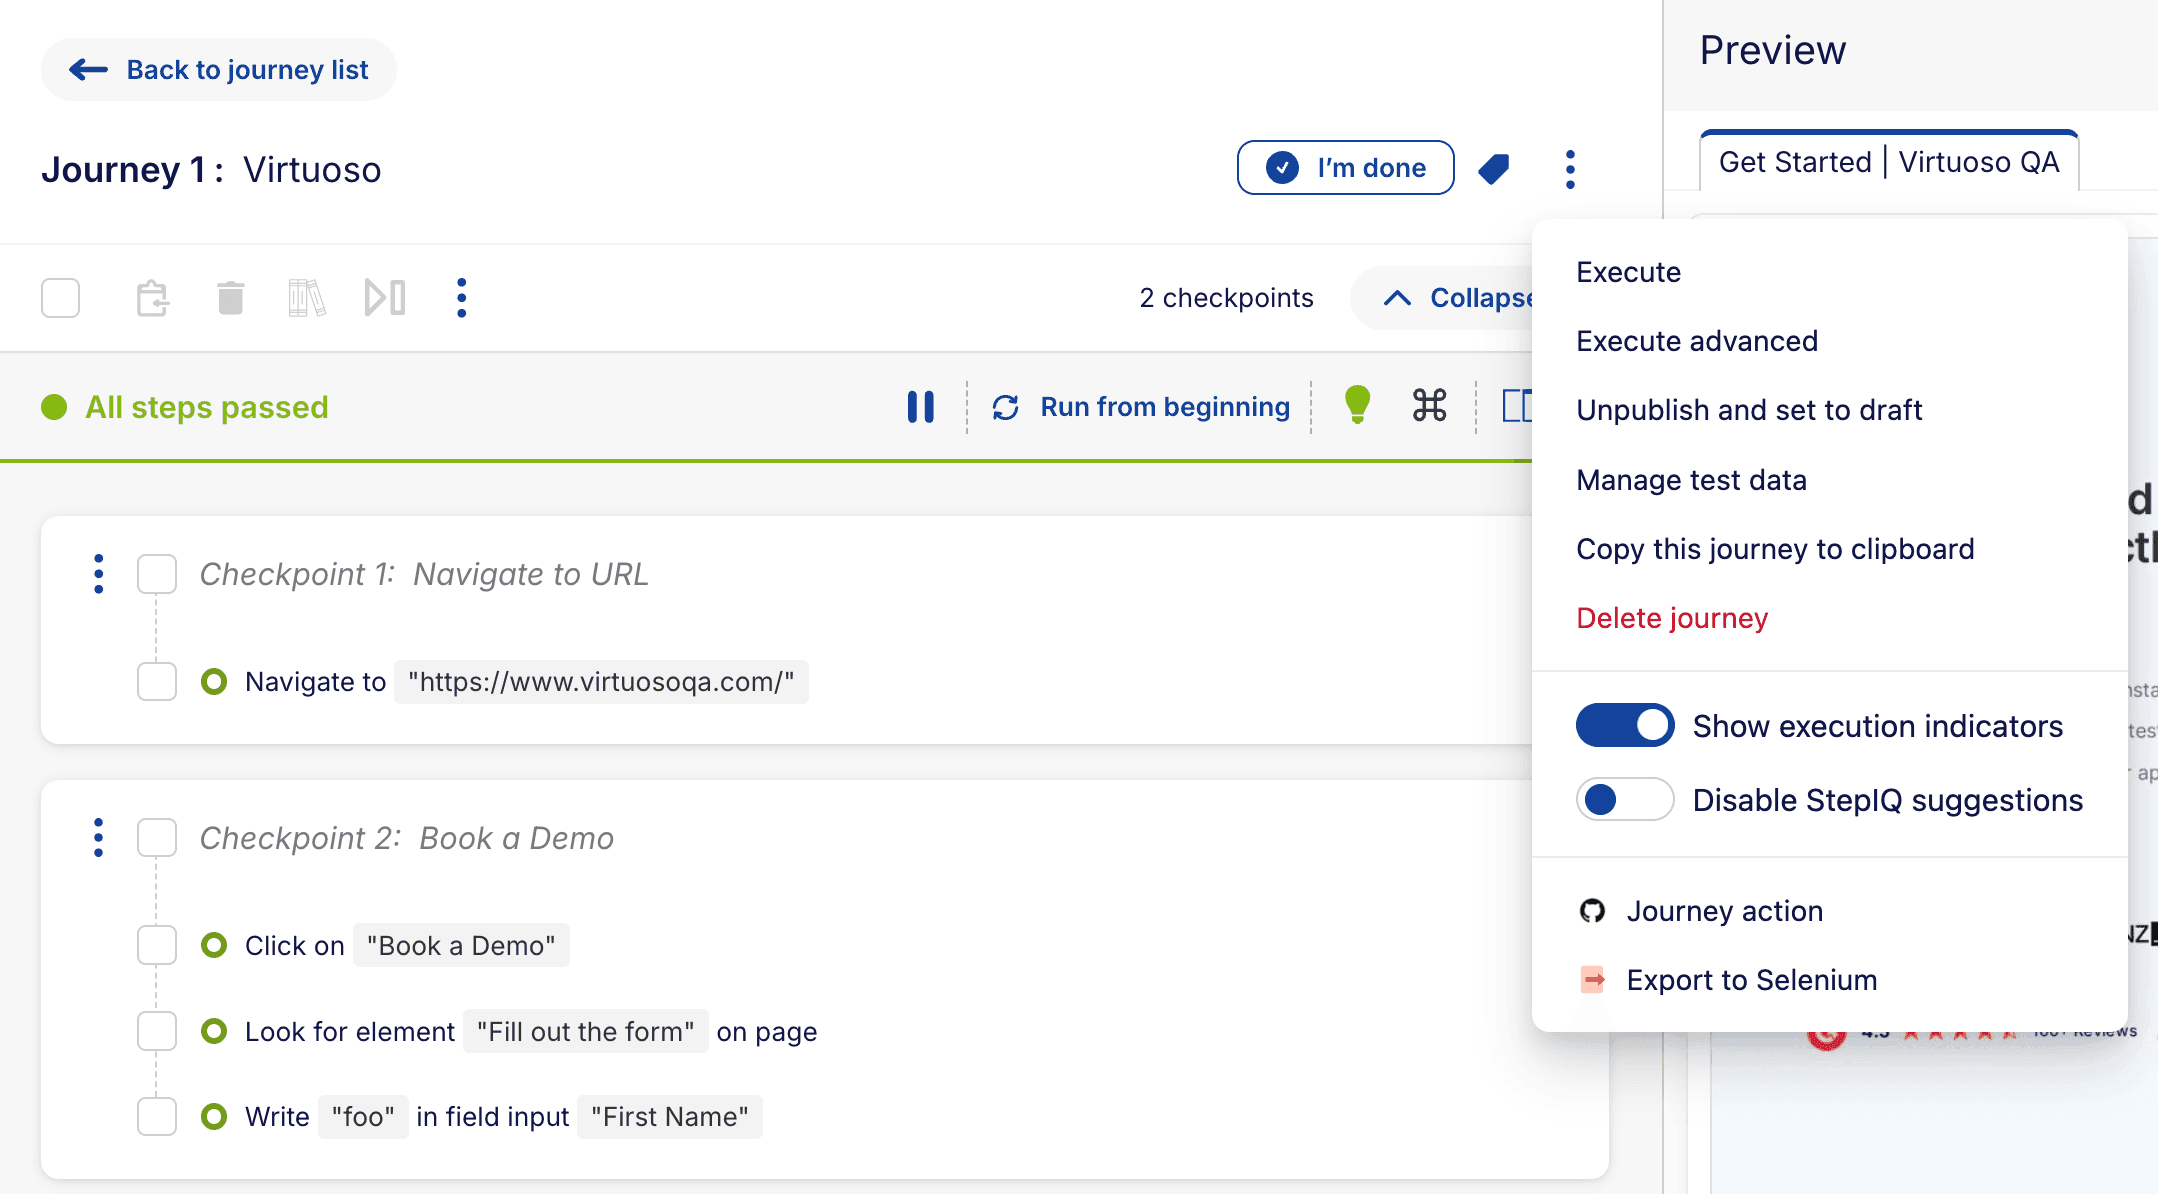
You can disable StepIQ suggestions for a specific journey by toggling the Disable StepIQ suggestions option, available in the journey's context menu. This can help if you notice lag while running larger journeys in Live Authoring.
Upcoming enhancements
We’re just getting started and are continuously working to make StepIQ smarter and more helpful. Here’s what’s coming soon:
- Better, faster, and more relevant suggestions: Improved understanding of your application to provide more accurate and useful step recommendations
- Smarter page insights: The ability to better "see" the page you’re testing, along with its structure, for more context-aware suggestions
Stay tuned for these updates — we’re excited to bring them to you!