# Root cause analysis
One of the main reasons we write tests in the first place is to find bugs and regressions. But when an automated test fails, it could be due to any of the following:
- The test is correct, but the application is broken (either a regression bug, or a bug discovered by a new test), and a fault needs to be raised;
- The test needs maintenance, because:
- The application has changed; or
- The test is invalid (it is the first execution of it, and likely the wrong element is being targeted);
- The environment is in a bad state (flakiness).
# Getting to the bottom of why a test failed
To help you with finding the root cause, we help you quickly:
- Analyze the execution history of the journey and the step, people involved, etc.
- Review the recent activity on the journey from executions, to changes and comments left,
- Compare visually the current failing step with what it looked like when it passed last time,
- Comment and discuss the failure with your team,
- Review network traffic, console logs, and the page source (DOM) at the time of failure;
Once you have identified the root cause (e.g., whether it was due to a regression, flaky environment, or another reason) you can provide a reason for the failure.
To view this report, click on the failing step and click on the tab Root cause analysis where you can find all the information to determine why the test failed.
# Cause of failure
The error message displayed on top of the report shows why the step action failed. Usually, this gives you a clue as to what failed (e.g., Target element not found). Though, this does not immediately reveal the underlying root cause.
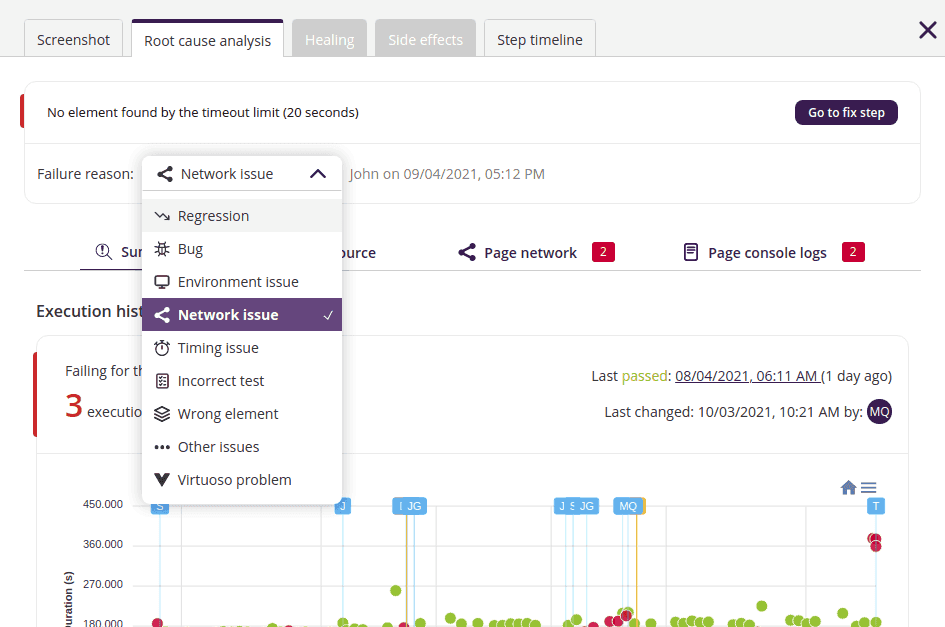
Underneath this, you are prompted to answer why this test failed (e.g., a Regression or an Outdated test, etc.). Providing this information can, over time, help you and your team build a better understanding of why your tests fail, which can help with understanding how to maintain tests and/or help you build more robust tests in the future.
Once a failure reason is set, it will show who set it and when. You can always change the failure reason, for example, the test failed due to a different problem from that which was first thought.
# Root cause summary report
This section helps you analyze the journey with respect to its activity, outcome, and trends over time, as well as to help compare it with previously successful executions.
# Journey failure explanation
Understanding why a test failed can be a time-consuming and complex process. Virtuoso leverages generative AI to provide an explanation of why your journey's execution failed. This empowers you to address issues swiftly and efficiently.
After you click on the Root Cause Analysis tab, you will see the "Analyze failure" button. Click this, and Virtuoso gets to work analyzing your execution. This can take a few seconds, but once it is complete, you will see one or more possible explanations of the failure. For this, Virtuoso uses information available on your execution to point to the potential causes of the failure, providing solutions when possible.

We use information such as extensions, test steps (with their respective states), and network logs to provide the explanations presented. In some cases, the explanation will not present a solution but will seek to point towards possibilities that can be explored to understand, and potentially address, the problems faced.
Data security
The information used from your execution is only stored in Virtuoso.
You can also jump directly to this panel and start analyzing the failure by clicking on the "Why did this fail?" button from either:
- The failed step highlighted in the Journey summary section, or

- The Screenshot tab of a failing step.

# Execution history analysis
The first part is the execution history analysis which tells you how many times this journey failed in the past or if it is the first time this journey has failed. For example, a test that has failed for the first time may require immediate attention, whereas one that has been failing consistently could be unmaintained or there might be a problem with it that cannot pass.
Here you can see the last time this journey passed including a link to that passed execution (note that a journey might never have passed before). Additionally, it tells you who updated this journey last and when.
To better understand the journey's history, as part of the execution history analysis, Virtuoso provides a chart that shows how this journey performed over the last 90 days. This chart shows green dots for passing executions, red dots for failed, and gray dots for other outcomes (e.g., skipped).
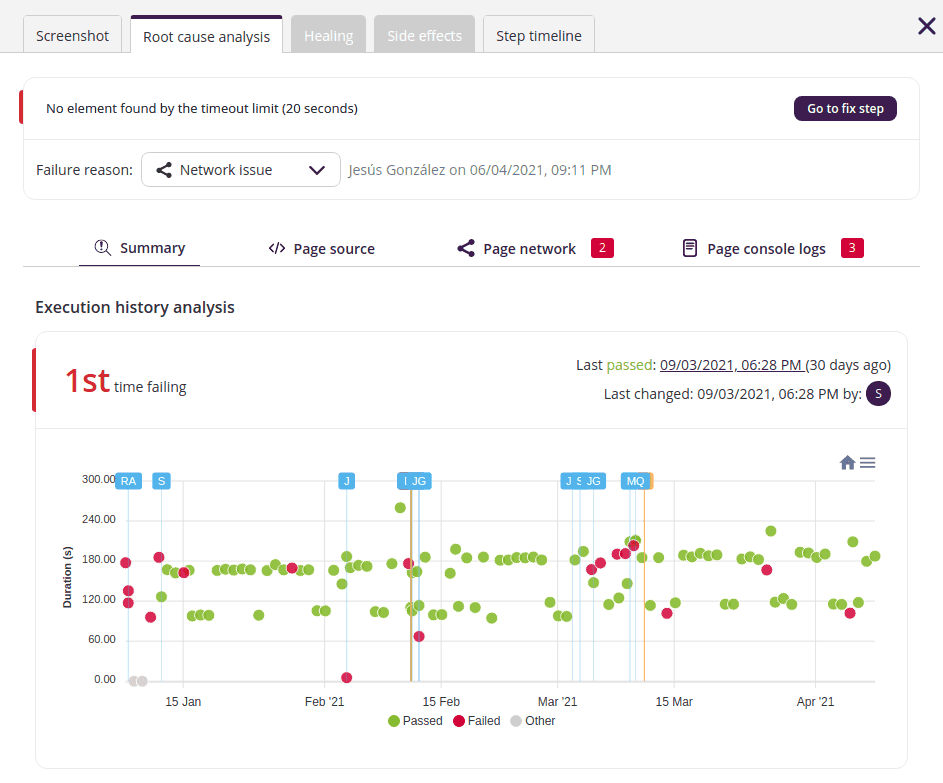
This chart is interactive, that is, you can drag your mouse over the chart to zoom in on specific time ranges. You can also click on any of the points drawn to open that specific execution in a new tab.
The chart also shows indications of when changes were made, and comments left. You can find these in the form of a vertical bar with a small box on top, along with the initials of the user who performed the activity. You can mouse over those annotations to see detailed information. Changes are represented with blue labels, and comments are represented with a yellow label.
# Visual analysis
If your step was successfully executed before, in this section you will find the snapshot of the last time this test step passed, and the snapshot of the current failed execution.
You can quickly see with this pair of screenshots if the page still visually matches the previous state, or that either the test or the application have diverged from previous behavior.
When available, you can also switch between the screenshot before and after interacting with a target element. E.g., you have a test step of this form Click on "login", in the last passing execution there is a screenshot before clicking on the element, and a one after clicking the element which may be different.

Click on the screenshots to open a modal to better review these screenshots side by side. In the modal, you have the ability to zoom in or out of the screenshots as well as panning to help compare the screenshots.
# Comments
In this section, you will find the latest comments left on the step timeline (by you or other members of your team) so that you and your colleagues can leave notes, discuss, or mention someone quickly.
To add a comment just type your message in the text box and press ENTER or click on the send icon; the same way as it works in the timeline panel.
# Page at the point of failure
One of the most common tasks when trying to figure out why a test failed is to manually get to the point of failure, and then to look at the page source, network traffic (e.g., find failing requests), and console logs.
To speed this up, Virtuoso captures the page at the time of failure, so that all the information mentioned is available to you right away.
# Page source
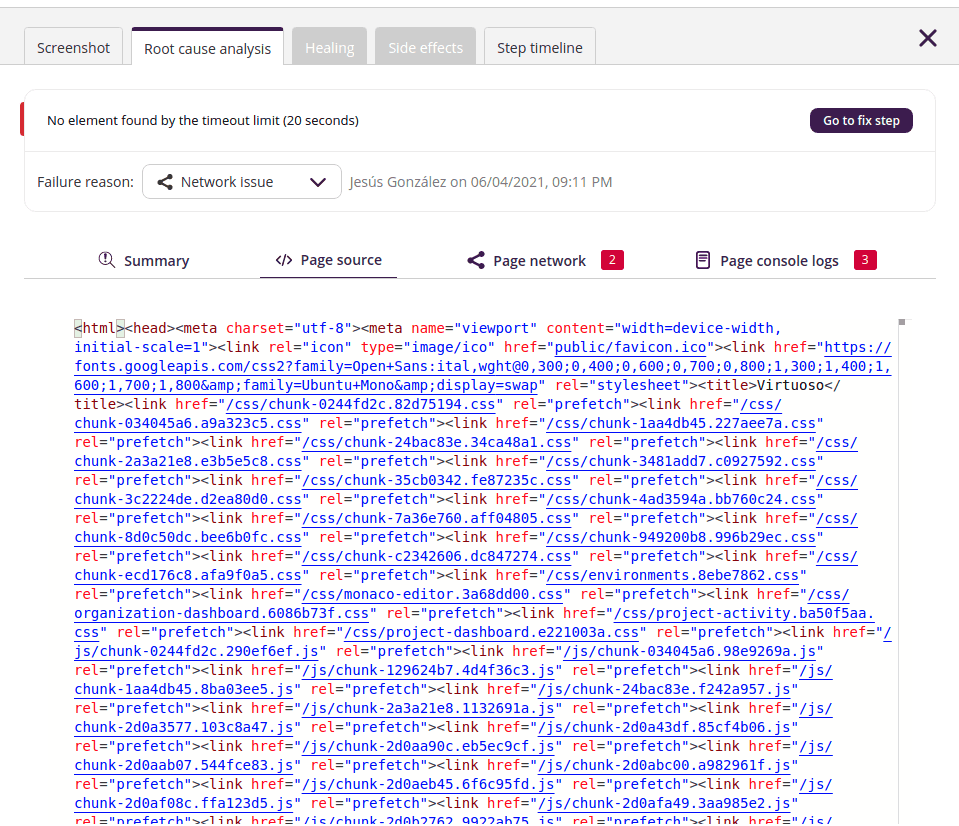
This tab will show you the HTML code / DOM that the browser used to render the page at the time this test step was executed (note that the page source might not be available in some specific cases, such as when running on a custom mobile device).
Sometimes looking at the page source can give you an insight into why the test failed, for example, you might be looking for an element that does not exist on the page because it is in fact inside an iframe or you can identify broken attribute values of specific elements or some other broken piece of HTML.
Ultimately, this shows the same view as you would see opening the page source or developer tools of your browser and inspecting the elements, and it saves time by making it unnecessary to replay the journey to simply view the source at the time of failure.
# Page network requests
In this section, you will see all the network requests that happened during the execution of your test. If a failing network request is found (those with a status code of 4xx or 5xx) a red badge is shown with the count next to the tab title to attract your attention.
The network requests are presented as a table of expandable items, each row shows the most relevant information about a request such as the URL, the method, the status code, the type, the size, and the time taken for the request. Clicking on the chevron icon of each row will expand that row showing the full details of that specific request (e.g., the request headers, timing metrics, the response body if available, etc).
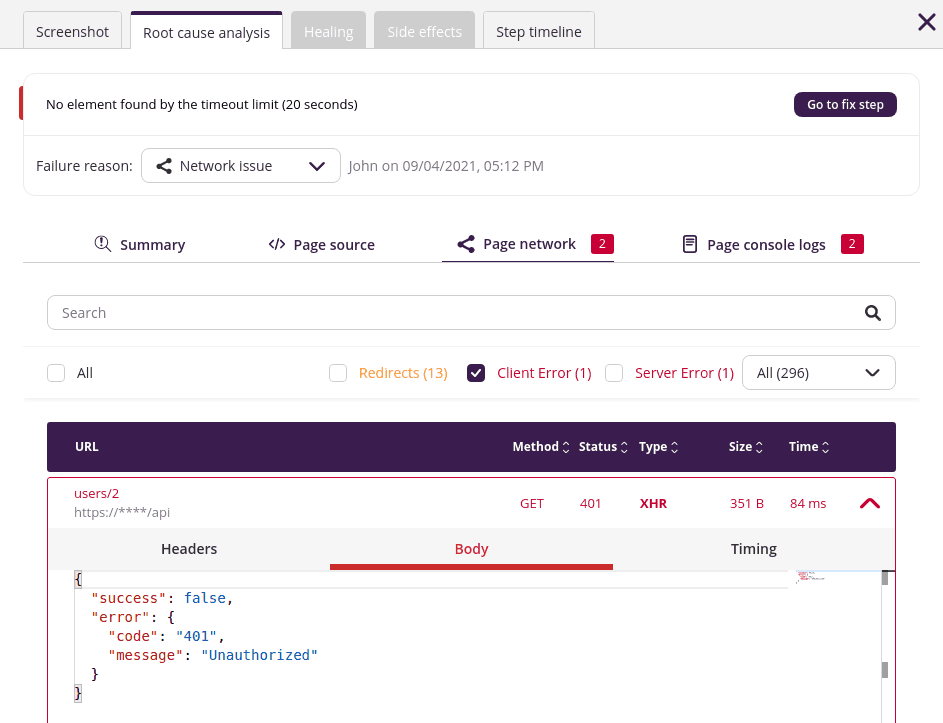
For an easier review of these network requests (there may be hundreds!), you can use the search box placed on top to filter out the results. You can also click to filter only network requests which faced one of these situations: e.g., client error or server error and finally, you can use a dropdown to filter by the different type of requests you have (e.g., XHR shows only AJAX network requests).
# Page console logs
The page logs often provide significant insights into why the failure occurred, particularly when the fault lies with the application. Virtuoso captures all the logs that you would see on your browser when using the console of the browser developer tools.
This means that if your website logged an error message or any other log that might lead you to the root of the problem, it will be shown in this section.
The information is presented in a scrollable list of items, with each item being a log entry. If a log comes with a trace besides the message itself, you can click the log entry on the list to expand it and see all the details.
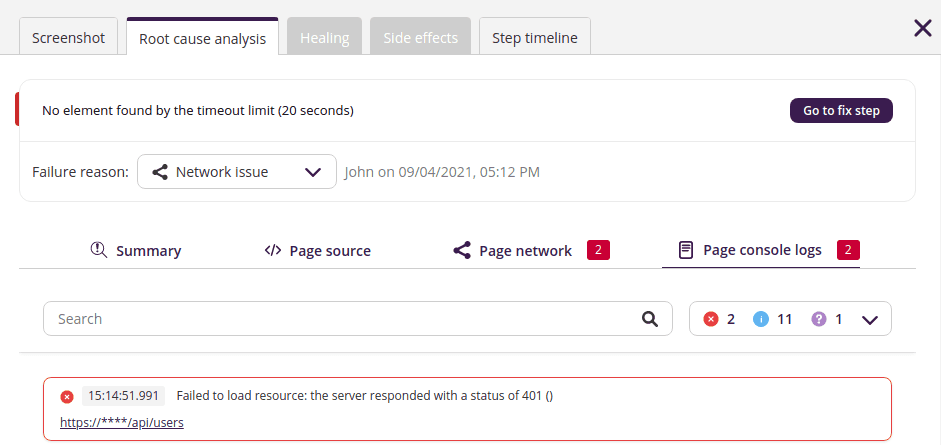
Finally, since you may have hundreds of log entries, the UI provides a search box to limit the results and a dropdown with the different categories of the log entries and a count (e.g., 2 error, 13 warning), clicking on a category will limit the results to only that log category (e.g., show only error logs).
About the page context
The source code, and especially the network requests and console logs shown here are tied to the context of the page. This means that some of them could happen before the failed test step was executed (e.g., earlier test steps of the same journey). To see only the ones specific for this test step, please refer to Test step events.