# Organization management
If you are an organization owner the Organization dashboard will present additional sections to manage the organization (for the Project section see Managing projects).
You can collect information and manage several settings of the organization through these additional sections which are presented in the following topics:
- Checking usage statistics
- Managing members
- Managing teams
- Managing bridges
- Managing Virtuoso Apps
- Changing organization settings
# Checking usage statistics
To see the organization's usage statistics, click on Usage.
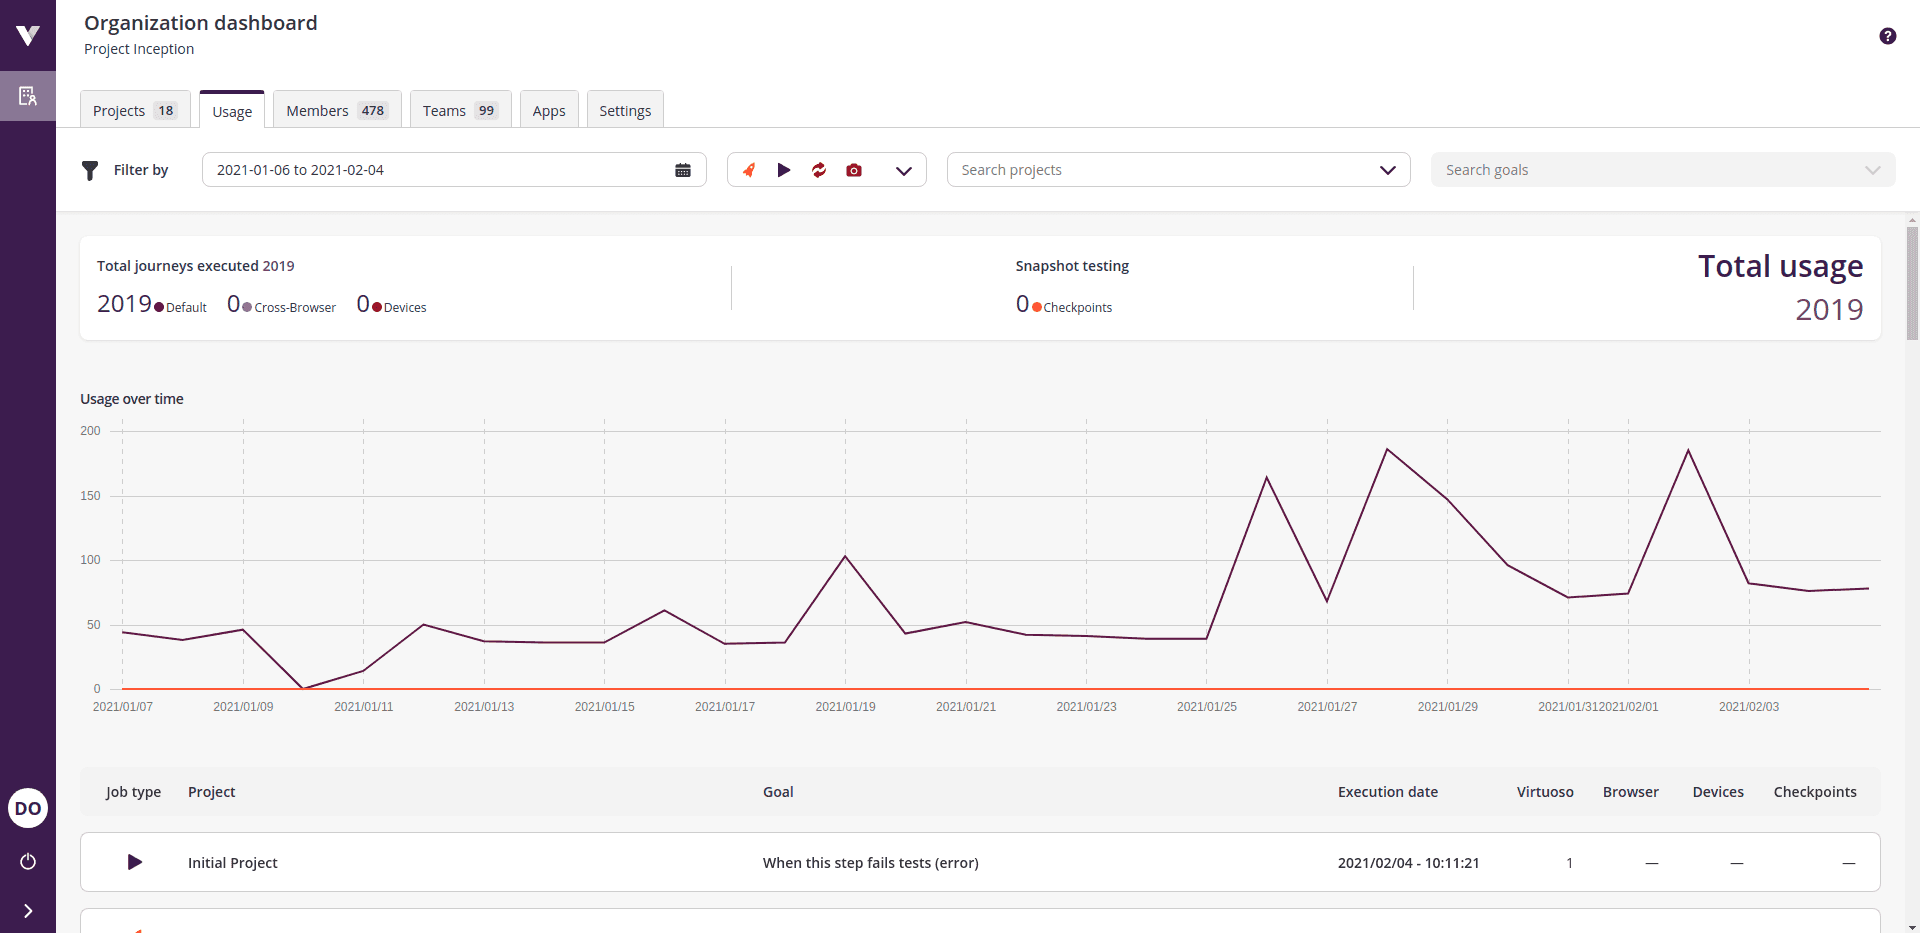
The screen is divided into four areas:
Filters: A set of fields to customize the scope of the usage analysis. There are four filters available:
Date range: Use this filter to select the start and end dates for the usage analysis. Usage data presented will be limited to the period between the selected dates. By default, the selected period will be the last 30 days;
Job type: Use this filter to select the types of jobs to be included in the usage analysis.
Project: Use this filter to limit usage analysis to a single target project. The statistics will only include operations executed for this project;
Goal: Only available if a project is selected. The selectable goals will be pre-filtered by the selected project. Use this filter to limit usage analysis to a single goal;
Summary: This area presents the sum of different types of jobs ran in the scope defined by the selected filter values. The left-most part of the summary presents the total number of journeys executed, which are then divided into default, cross-browser and mobile device executions. The center of the summary presents the total number of checkpoints compared in Snapshot Testing jobs. The right-most part presents the total number of executed jobs.
Chart: The chart area presents the daily aggregated usage sums, divided into default, cross-browser, device and checkpoint, for each day in the selected date range. The remaining selected filter values are also taken into account. Hover the mouse over a specific date on the chart to see the values for that day;
Table: The table is a list of all the jobs in the selected filters scope. Each row of the table details a job type, project, goal, execution date and number of journeys executed / checkpoints compared, divided into categories: default, cross-browser, device, and checkpoint.
Clicking the project name on a table row will open the dashboard in a new browser tab, with the corresponding project selected as active. Similarly, clicking the goal name will open the corresponding goal view page in a new browser tab. Finally, clicking the execution date will open a new browser tab for the job execution page.
# Managing members
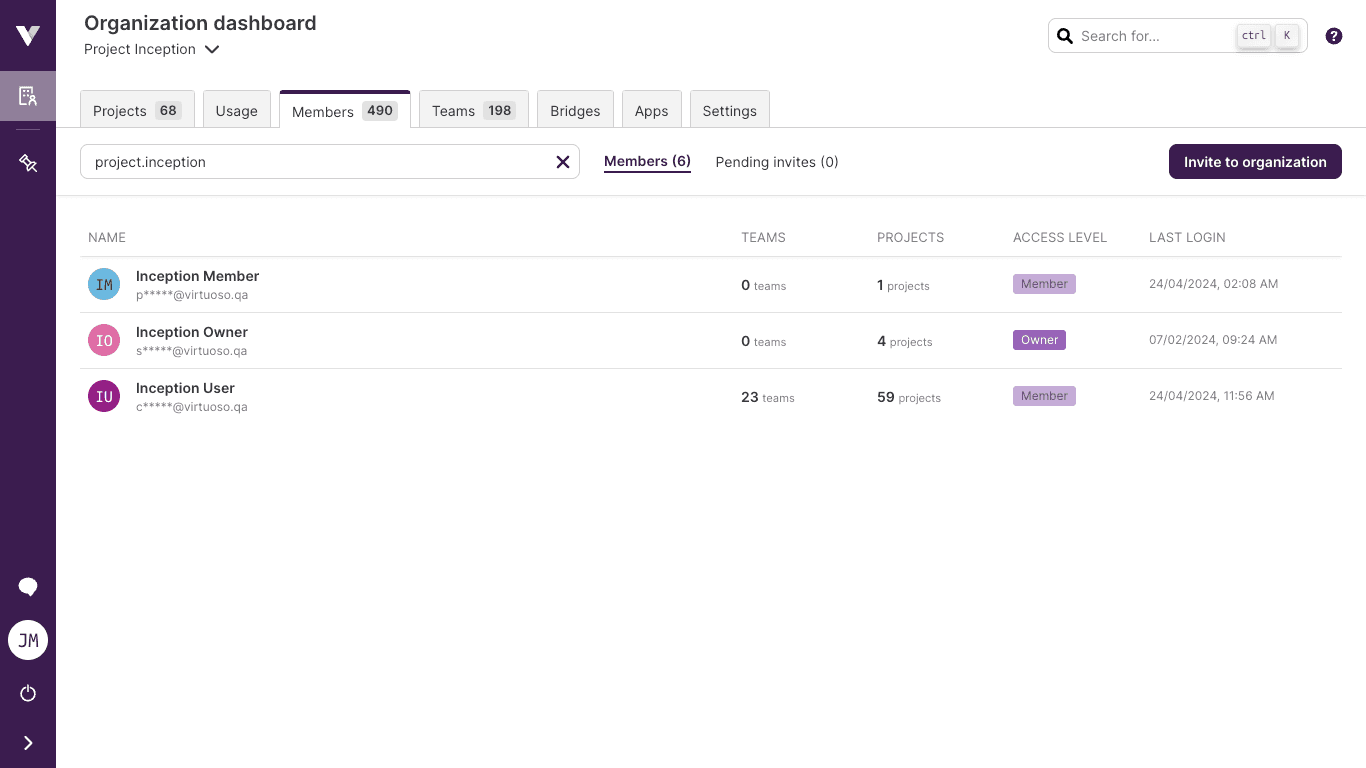
The Members section lists all current organization members. For each member it presents:
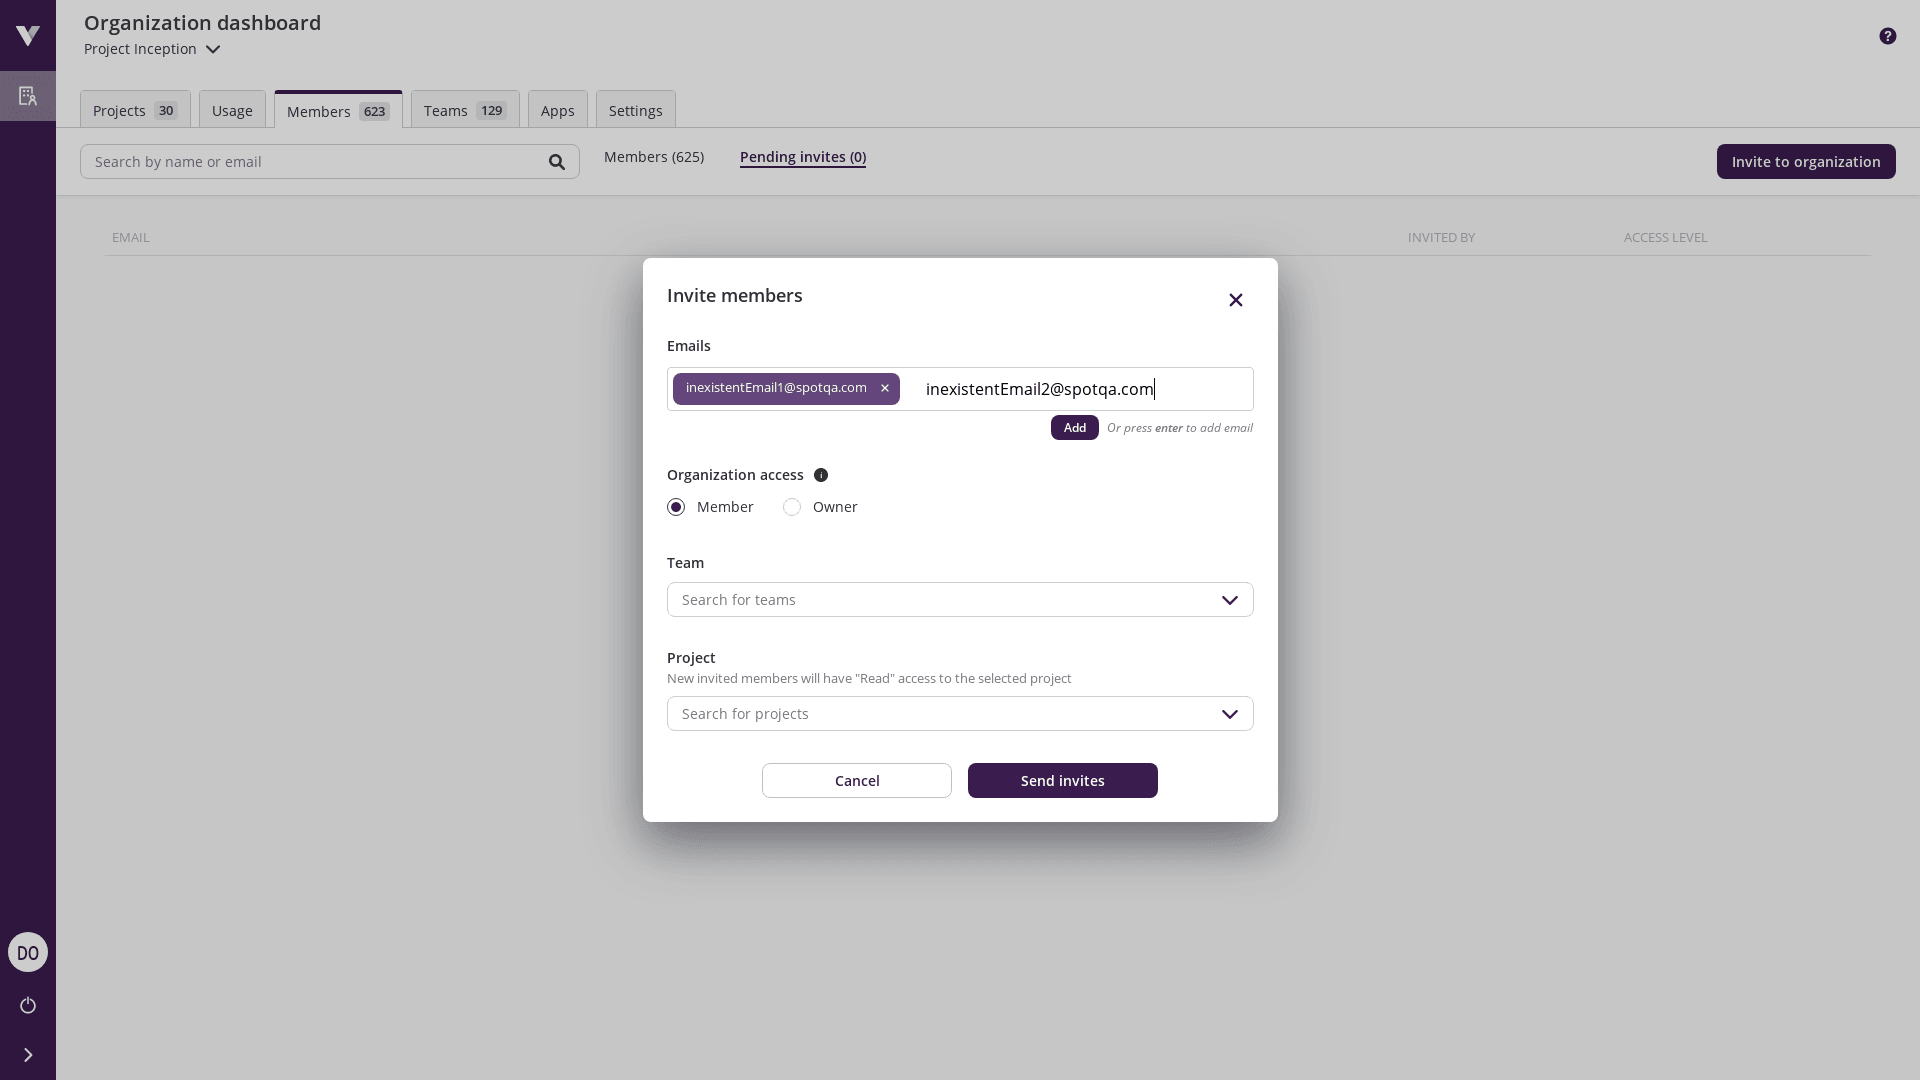
To invite more people to the organization, click the Invite to organization button. A modal will be shown where the organization owner can provide as many emails as needed, indicate the access level, and, optionally, a team the new members should join and a project they should have access to. More teams or projects can be added after the user accepts the invite. To invite new users with different access levels, teams, or projects, repeat the process as many times as needed instead of adding all emails at once.
The list of members can be filtered by name or e-mail. Near the search field, an organization owner can see the current number of members and pending invites.
Organization members limit
The pending invites are considered while enforcing the limit on the number of organization members.
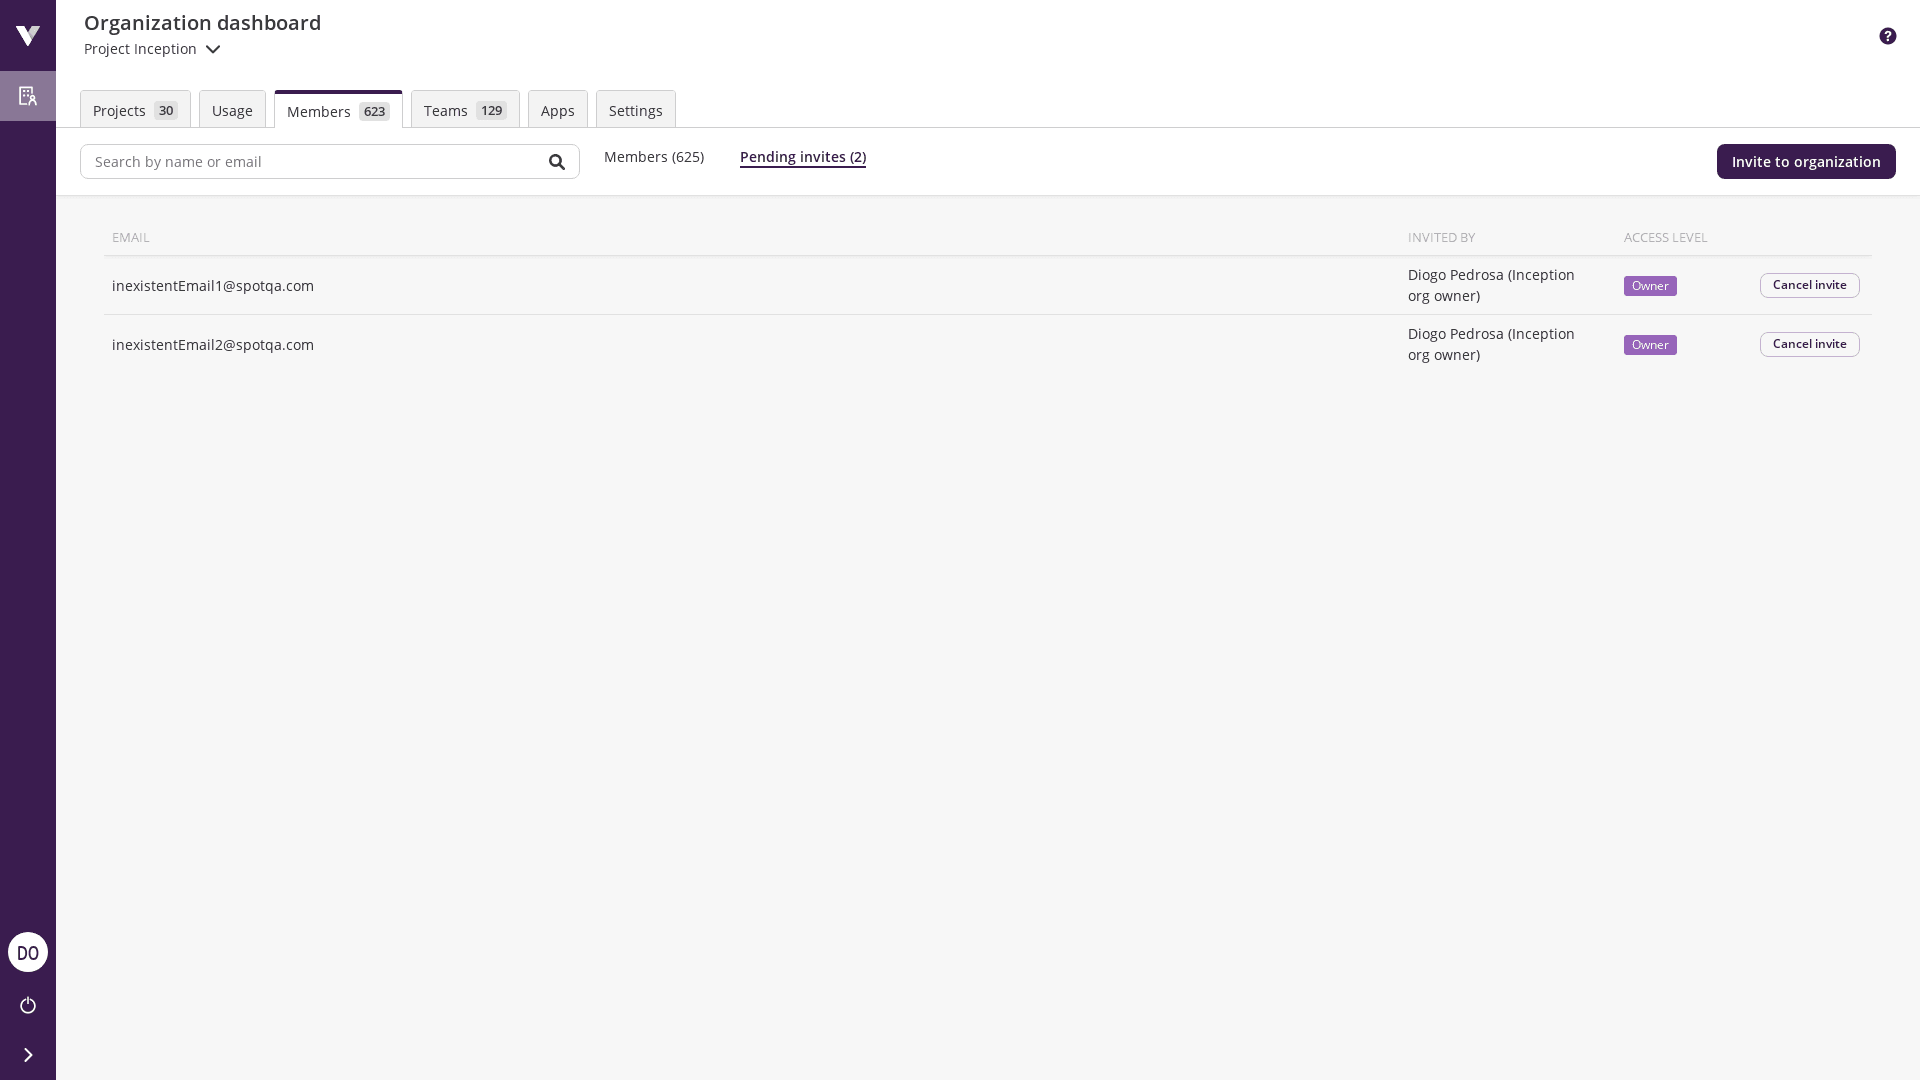
Clicking on Pending invites shows information about the invites (invited email, inviter's name, and the access level granted), and clicking on Cancel invite revokes an invite that was not accepted yet.
The invited person will receive an e-mail containing instructions on how to proceed with the registration, which consists of clicking a link followed by providing a name and password.
When an invite is accepted, it is no longer shown in the Pending invites list, and the new user will appear in the Members list.
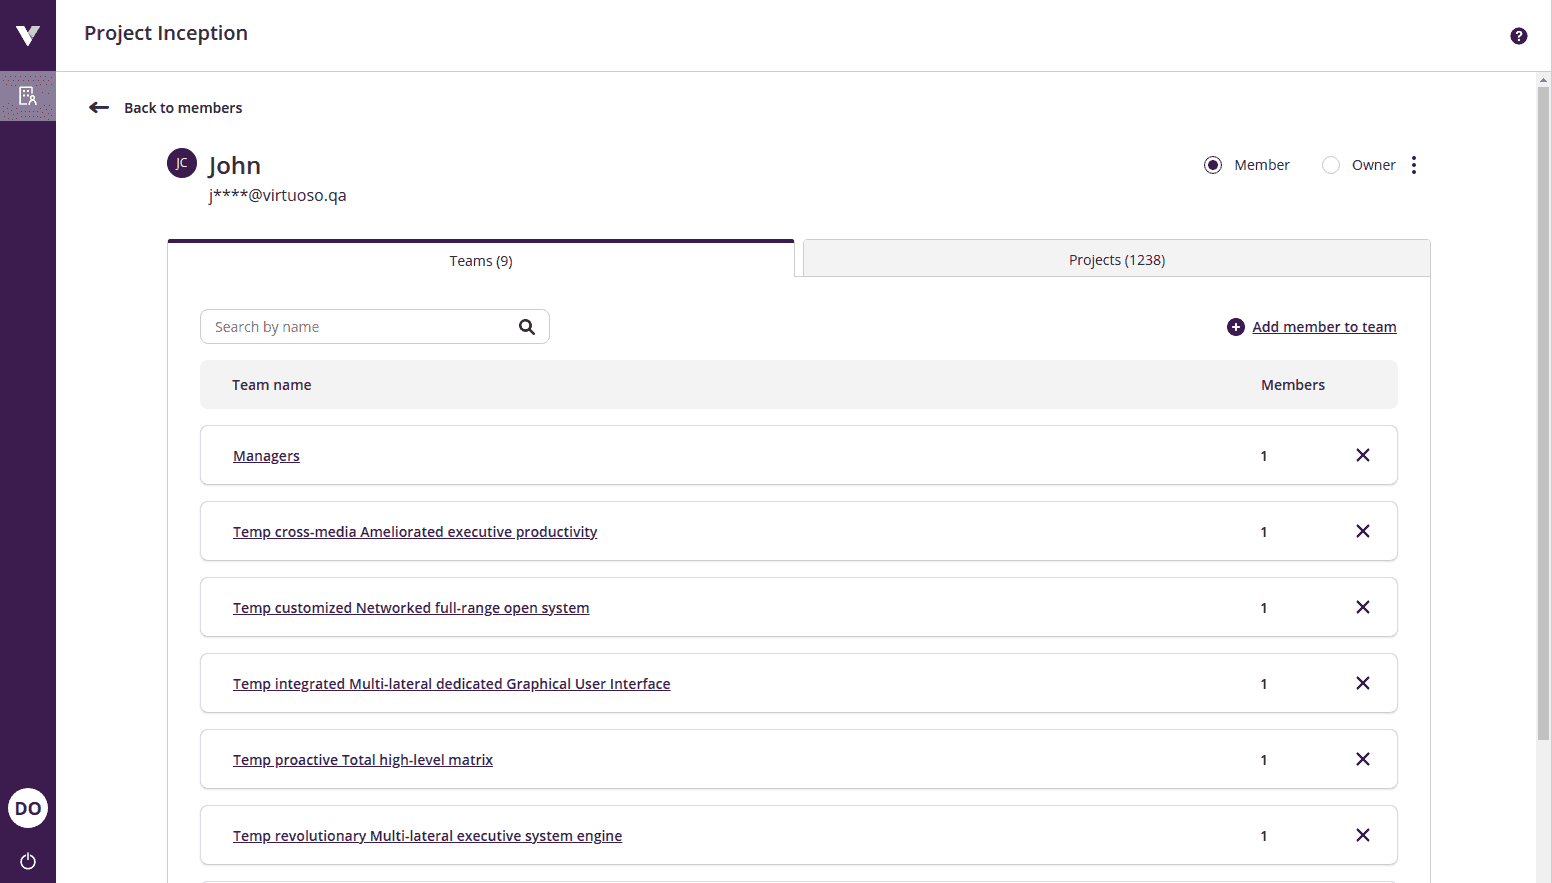
By clicking over a member, an organization owner can see the list of teams the member is part of and the list of projects the member has access to. The lists can be searched by team/project name.
Read more about project permissions and users at Sharing your project with other users.
# Managing teams
The Teams section lists all current organization teams. Teams allow giving to a set of users access to a set of projects.
There is no limit for the number of teams nor the number of members or projects in a team.
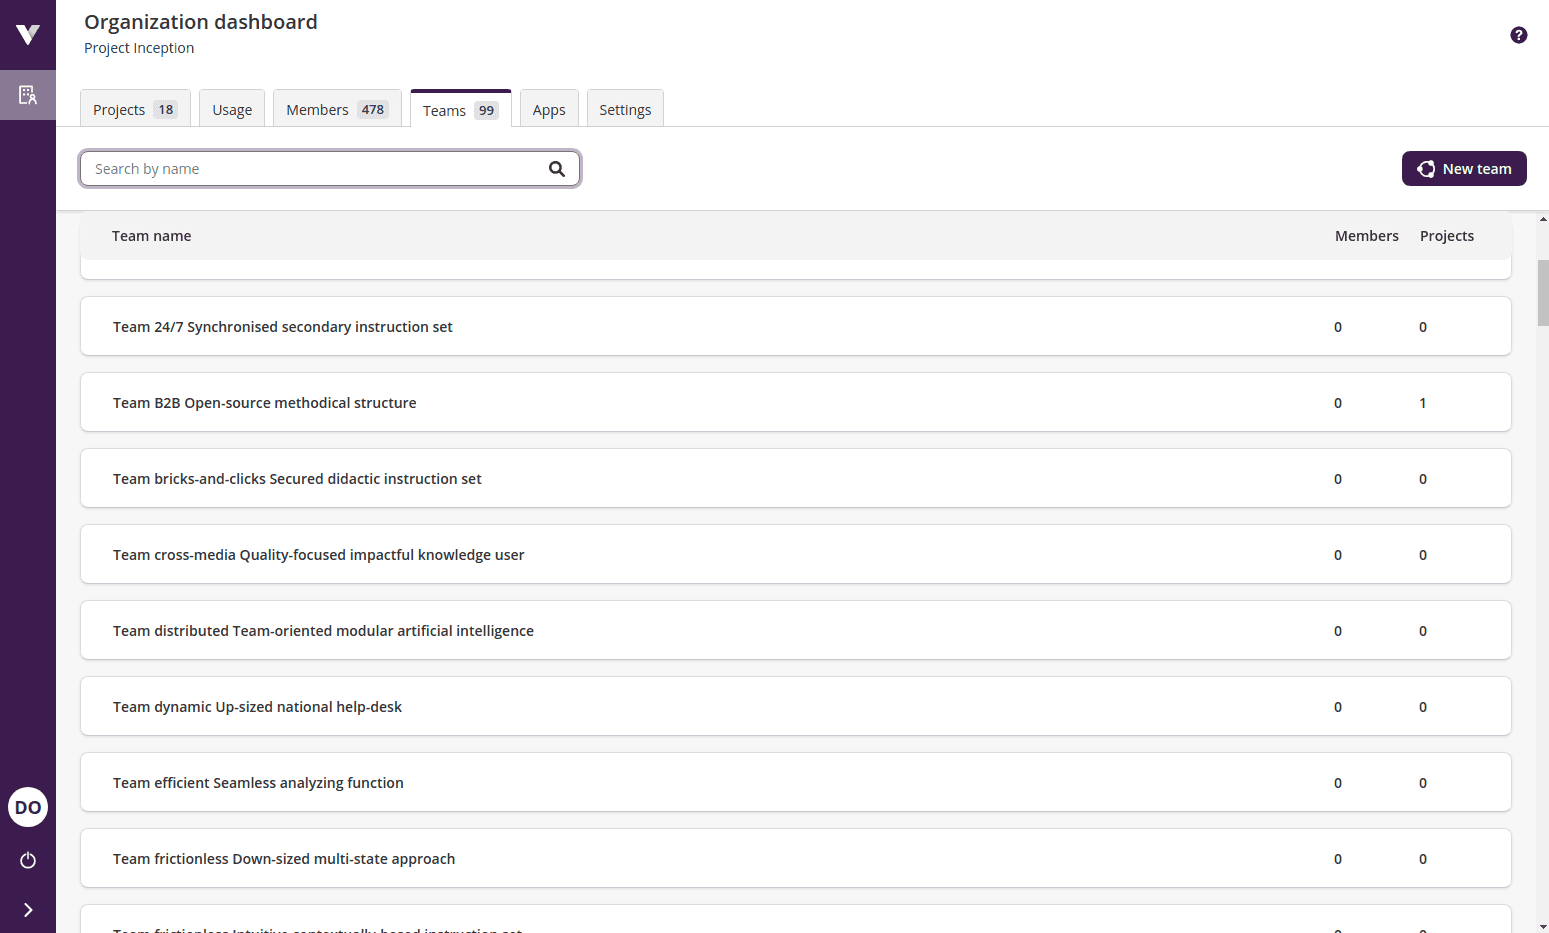
The search can be used to filter the teams exhibited by providing a name or part of a name.
To create a new team, click on the New team button on the top right side. A modal will be shown, where the organization owner can provide the team name, which has to be unique within the organization.
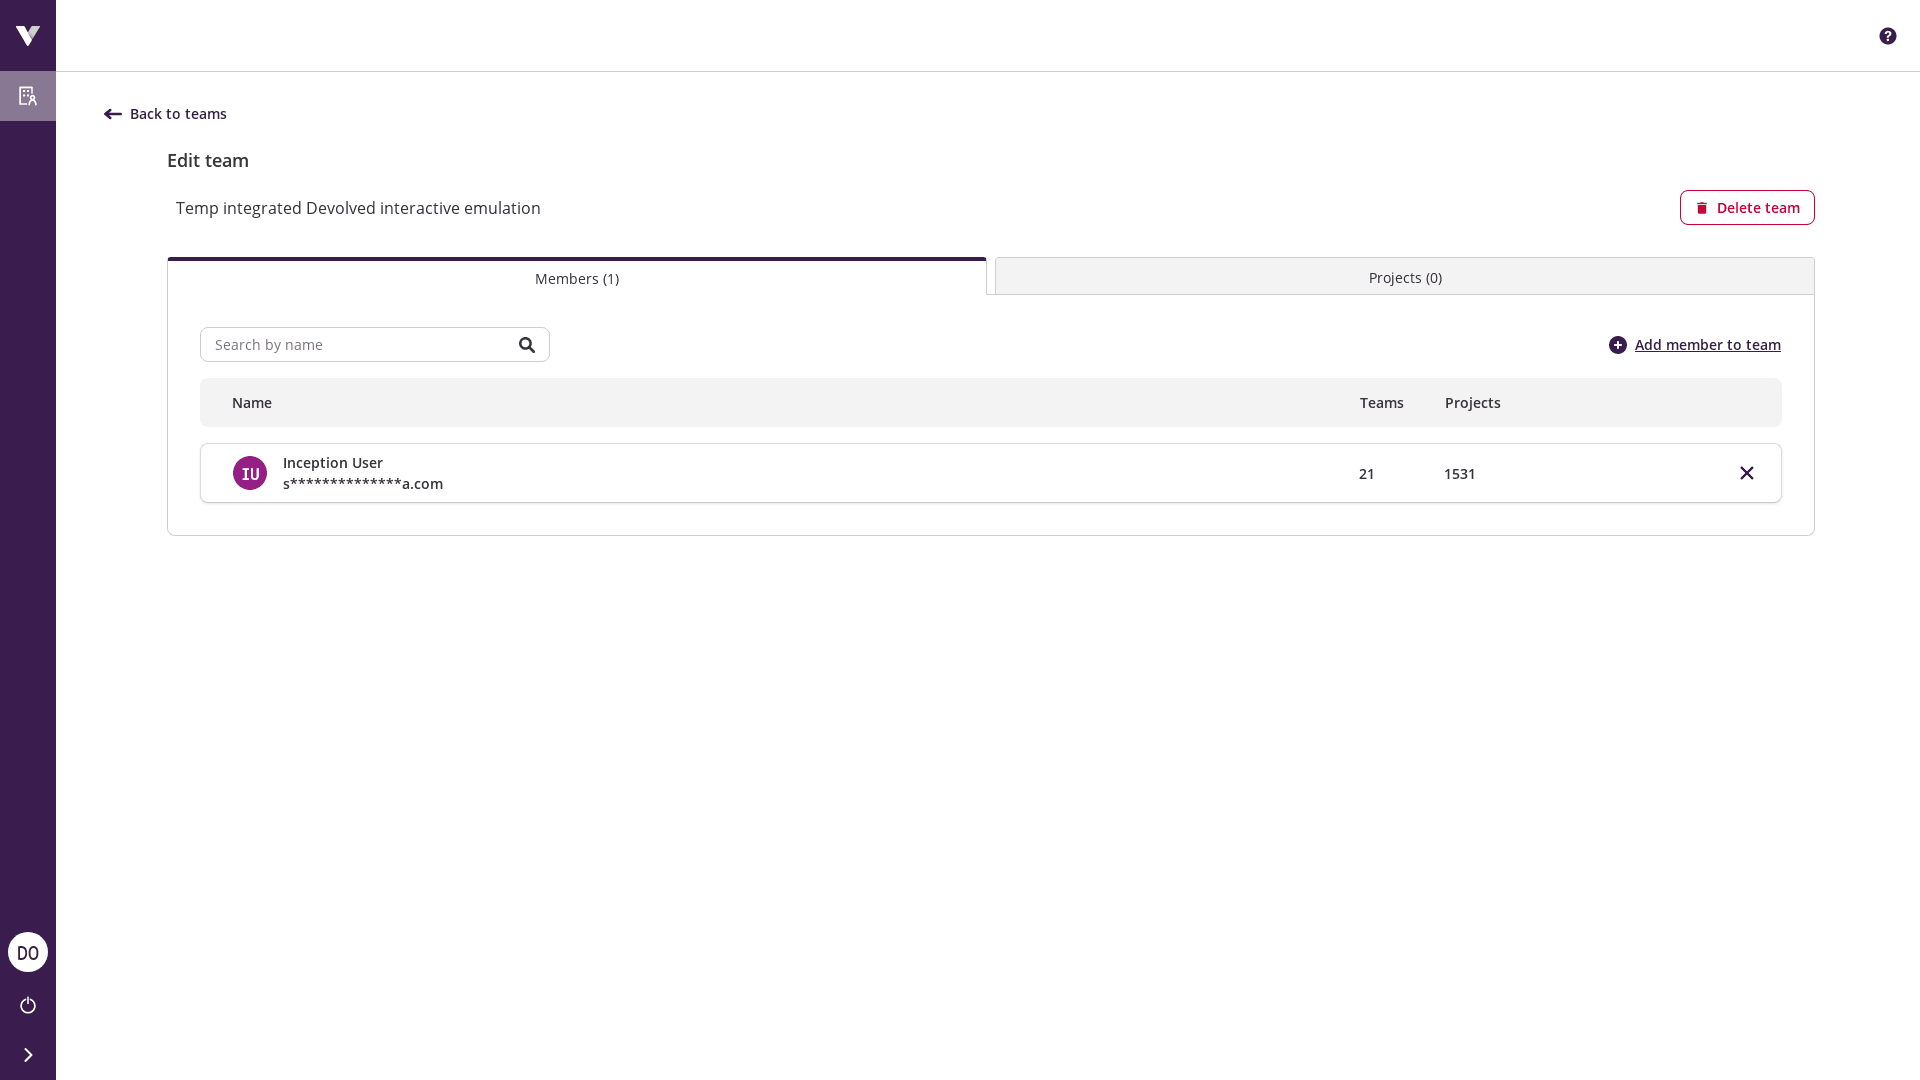
By clicking over a team, an organization owner can see its members and the list of projects its members have access to. The number of items in each list is shown in the respective tab title, and the items can be filtered by searching by member/project name.
The team can be renamed by clicking on its name. It is also possible to delete the team by clicking on Delete team in the upper right part of the screen.
The Members tab shows for each member the number of teams the user belongs to and the number of projects the user has access to. An organization owner can remove the user from the selected team by clicking the remove icon .
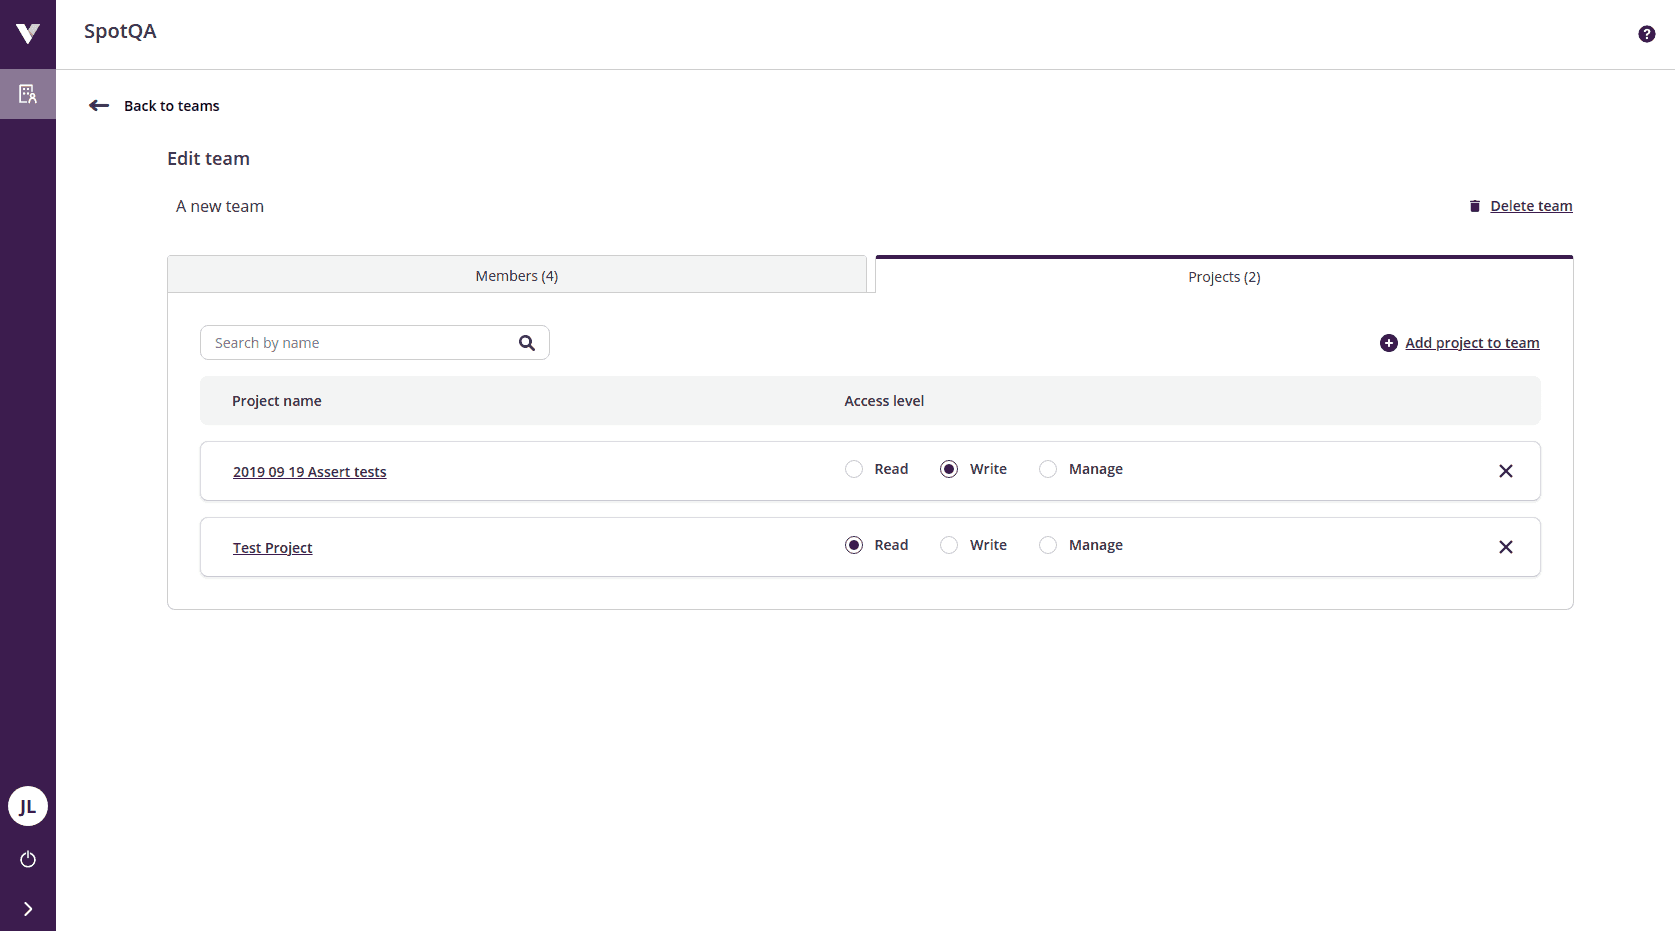
The Projects tab shows for each project the project permissions that the members of the team will have.
Read more about project permissions and teams at Sharing your project with teams.
# Managing bridges
The Bridges section lists all the bridges associated with the current organization. Bridges allow Virtuoso to access local or private applications without the need for changes on the firewall or routing rules on the infrastructure.
They are always associated with the user whose credentials were used to first set up the bridge by launching the Bridge Client.
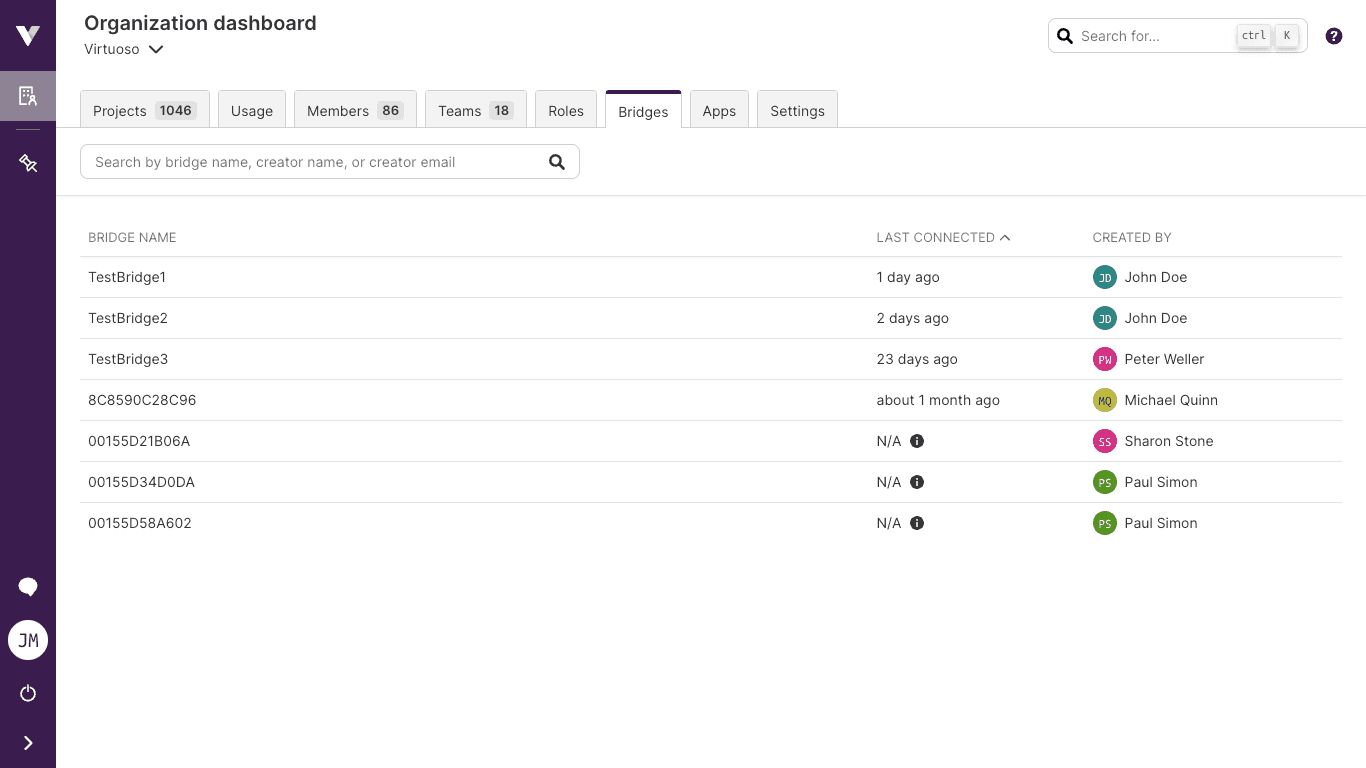
The search can be used to filter the bridges shown by their name, the creator's username, or the creator's email.
Each item on the list displays the following information:
- Bridge name - the identifier given to the bridge by either using the
-n / --nameoption when starting the bridge client, or by default the MAC address of the network adapter; - Last connected - how long ago the bridge client last connected to the Virtuoso Bridge Server;
- Created by - the user associated with the creation of the bridge;
The list can also be sorted by any of its columns.
Bridge connection status
Virtuoso does not yet have a status indicator for the bridge connection.
The Last connected column displays when the Bridge Client last connected to the Virtuoso Bridge Server, but it does not guarantee that the bridge is currently connected. The client application may crash or have been terminated abruptly, not informing the Bridge Server that the bridge was to be removed. In such cases, a date will be displayed but the bridge is disconnected.
It may also happen that the client has been launched and running since before Virtuoso started recording the connection date. In this case, the value N/A will be displayed.
# Managing Virtuoso apps
Note about the usage of "app" vs "integration"
As Virtuoso evolves, at some point, we decided that app better fits as the name for these entities, this means that in the UI you will see app instead of integration and that eventually, all our documentation will use apps to refer to integrations.
The Virtuoso apps section lists all the apps that are currently installed or available for you to install in your organization. It allows you to create, install, configure, and uninstall apps. See what Virtuoso apps are and how to perform any of these actions in the Virtuoso apps section.
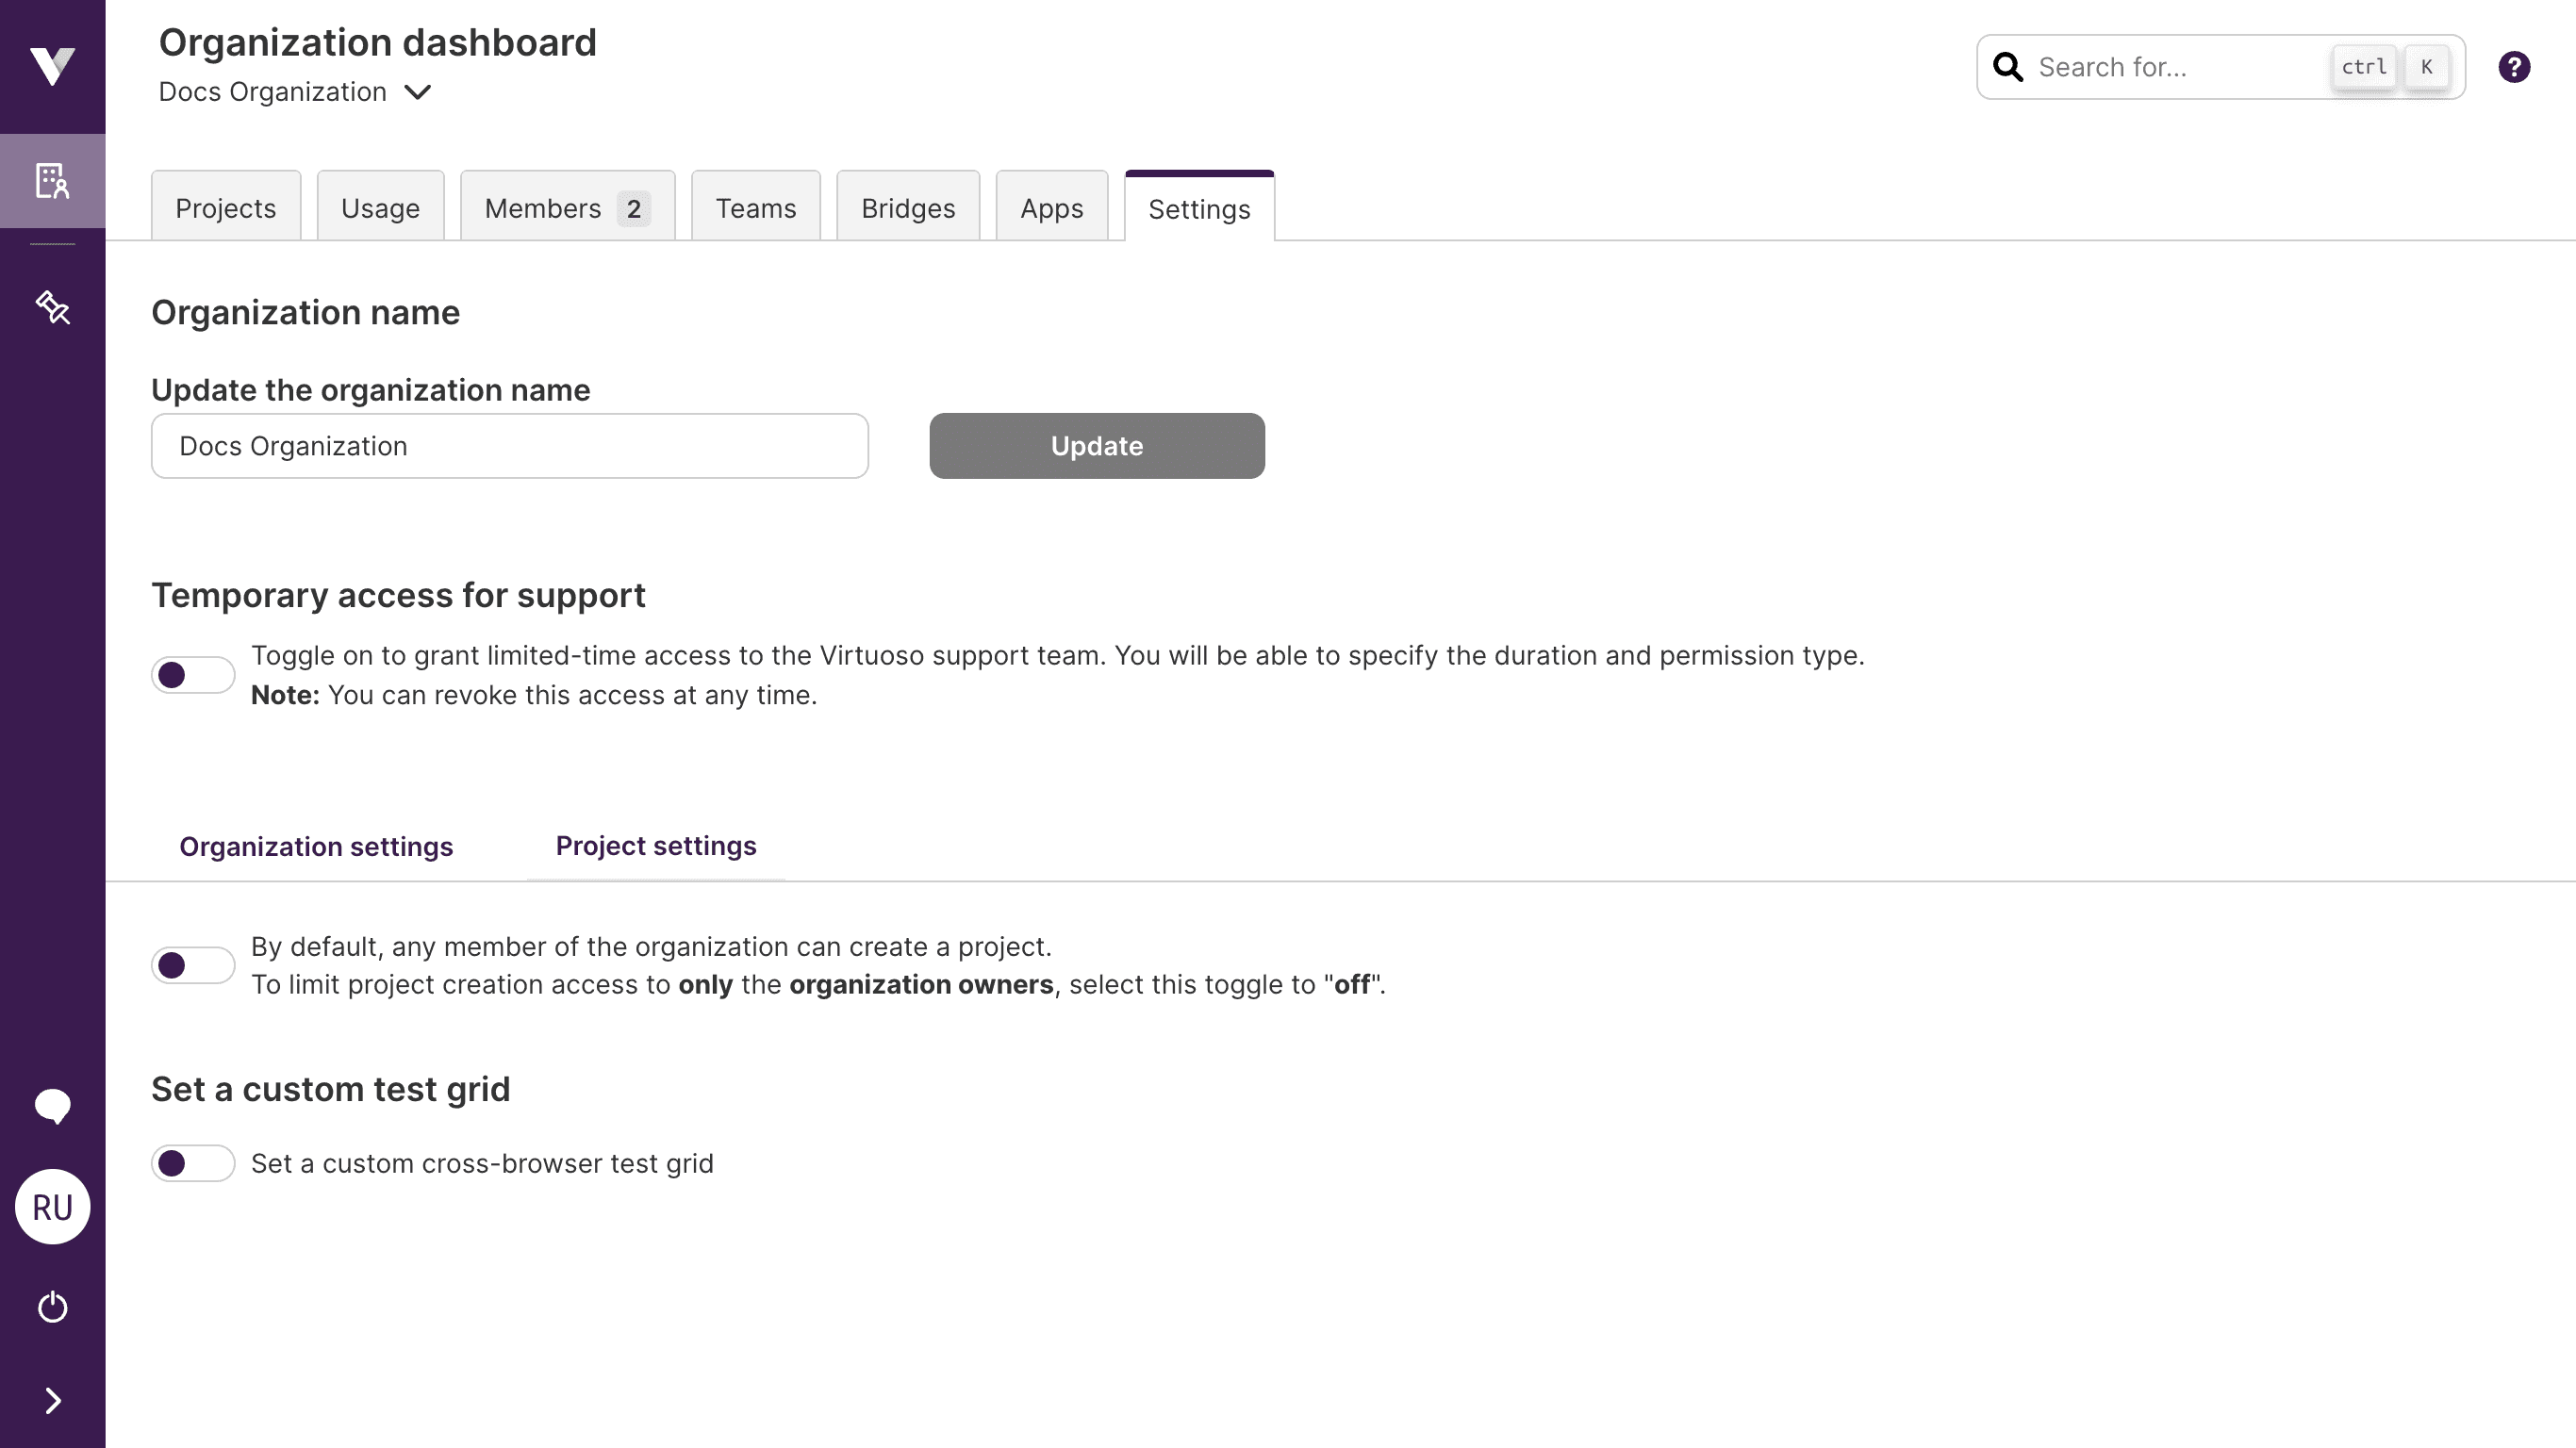
# Changing organization settings
The Settings section is the place to define organization-wide settings, such as organization name, the ability for members to create projects, and defining a custom grid.
# Bring your own cross-browser grid
You can run cross-browser executions with your own custom grid if you toggle on Set a custom cross browser test grid. The first time this is enabled, we will prompt you for the information required to use the provider account in Virtuoso:

We currently support web and mobile automation grids provided by BrowserStack. If you are using this provider, your account with the provider needs to be on one of the respective automation plans.
At the time of this writing, you can choose between the following options based on your requirements:
- Browserstack -
AutomateorAutomate Mobile
In the URL section, paste the full address of the grid, with the username and password embedded. This will be in a format of: https://YourUser:[email protected]/*. After pasting the URL, we will automatically detect the provider.
Besides the URL, you need to set how many parallel executions your grid license supports (this value should never be larger than), as well as whether your grid license includes mobile execution.
After submitting the form, your custom grid is setup in Virtuoso and it will take up to one minute to synchronize your grid settings across the platform. Once a custom grid is defined, you can edit the settings in the same place:
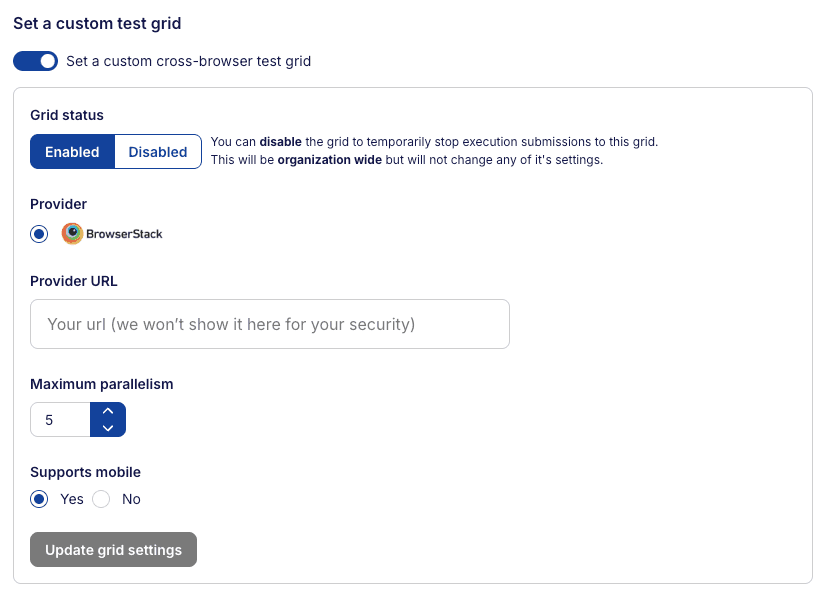 For security reasons, we will never show or reveal your currently set grid URL, but you can set a new URL if desired.
You can also disable your custom grid at any time, whilst retaining the settings by changing the Grid status to Disabled and saving the change. Disabling a grid blocks new jobs with custom devices from being processed while the custom grid is disabled. However, this does not affect currently executing journeys.
# Temporary access for support
You can grant temporary access to the Virtuoso support team. This will allow Virtuoso support team to access your organization for a limited time, in order to help you with any issues you might be facing. After the access expires, the Virtuoso support team will no longer have access to your organization resources.

To enable the support access toggle on Temporary access for support and set the duration of the access and the permission type. Detailed information on the permissions can be found in the Sharing section. It is important to note that the Manage permission is equivalent to organization owner.

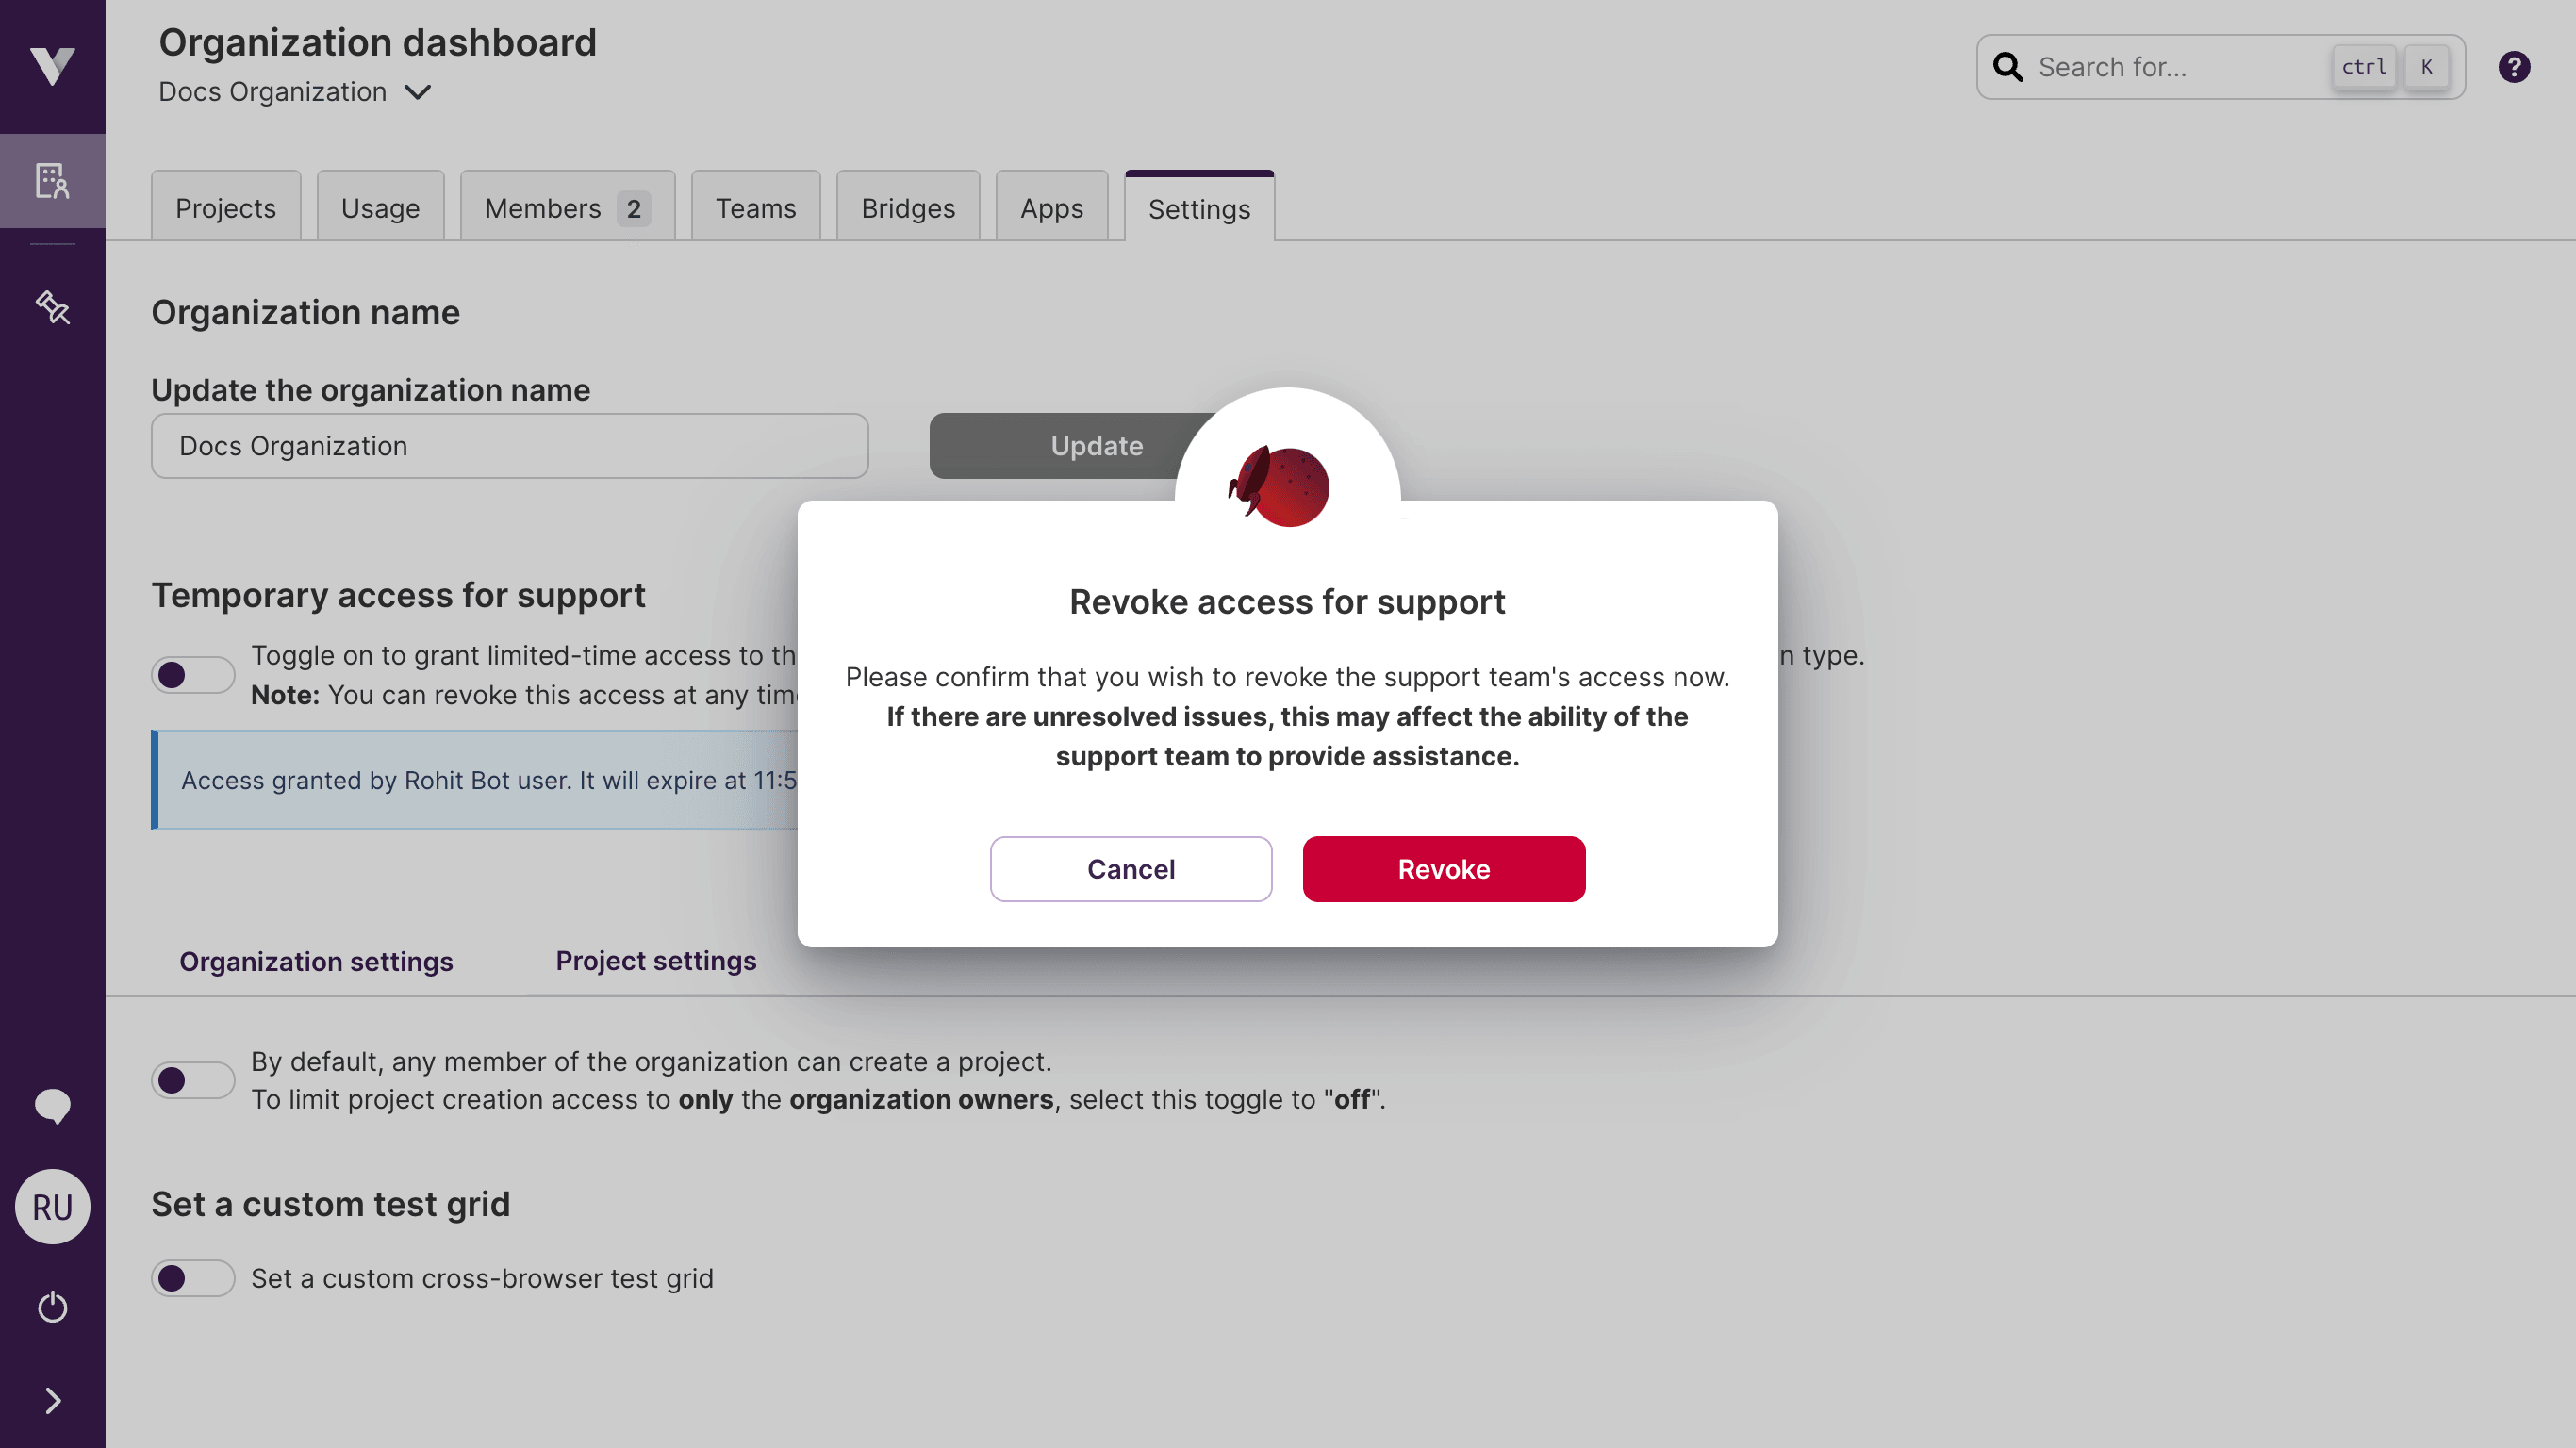
After support access is enabled, the expiration date and the user who enabled it will be shown on the page.

If you need to extend the access or change the permissions, you can do so by clicking on the Update access button.

You can also revoke the access at any time by toggling off the setting.
TIP
Only organization owners can enable or modify the temporary support access settings.