# Understanding the execution report
Once you execute one or more journeys, clicking on the resulting execution job will take you to its execution report. In this section, we look at different parts of this report and how to make the most out of it.
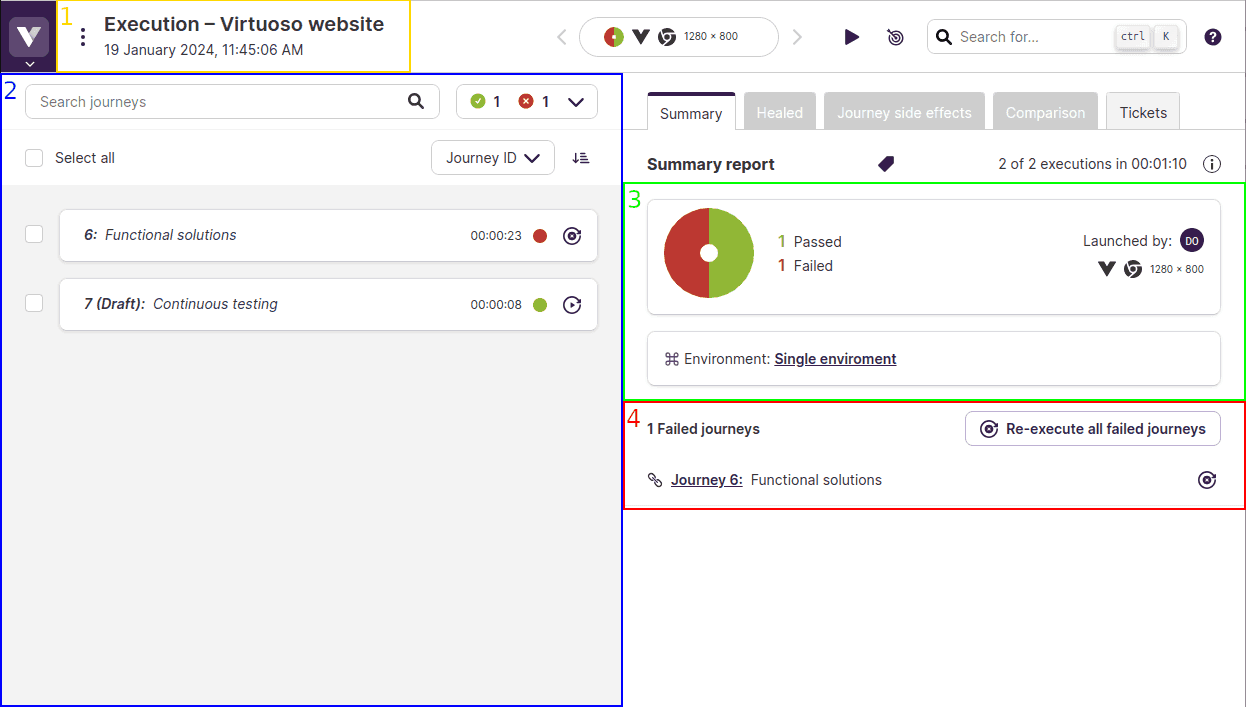
The execution report has four main sections:
- Goal name and job submit date;
- List of journeys;
- Overall test execution summary, including the current status of the execution, and any other attributes related to the execution (e.g., tags, custom starting variables or headers, users who launched/stopped the journey, etc.);
- List of failed tests (if any are present).
This view can be accessed even when the execution is running, and will update live as the execution progresses. Once the execution finishes the timer stops, and the details about tests that failed are presented.
# Journey execution report
Clicking on one of the journeys will open the journey execution report showing the associated checkpoints and test steps. When a test step is clicked, the screenshot taken by Virtuoso after performing the step will be displayed:
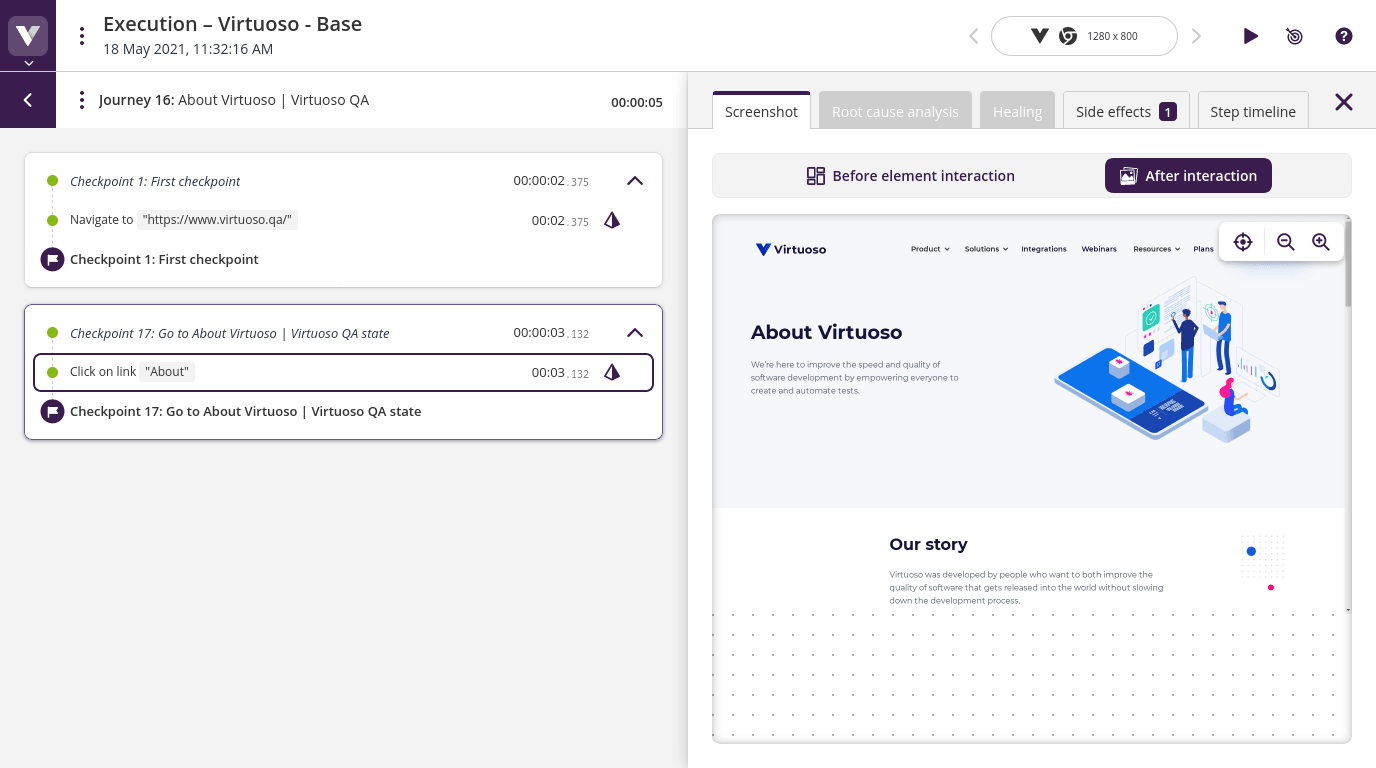
Clicking on a failed step will have a root cause analysis tab, which will help you get to the bottom of why the test failed.
# Journey execution times and summary report explained
# Individual journey durations
We display the duration of each journey execution in the list of executed journeys and in individual journey reports. This duration represents the time the journey was actively running test steps. For a comprehensive breakdown of the total execution time, hover over the duration to reveal a detailed tooltip.

In data-driven executions, the journey execution report shows the duration and breakdown for each sequence individually. In the main execution report, which lists all executed journeys, the duration shown is that of the first executed sequence.
# Time components for individual journeys
- Throttled: the throttling duration due to max parallelism
- Queued: the time spent in the queue awaiting resources or to ensure fair usage across different organizations
- Duration: the time the journey was actively running test steps
- Total time: the sum of the previous three values
# Summary report
The summary report provides an overview of all executions in a single run. It shows:
- Total number of executions: how many journeys were executed in this run
- Overall execution time: the total time from the start of the first journey to the completion of the last journey
# Key difference
The overall execution time in the summary report may be different than the sum of individual journey total durations. This is because:
- Journeys can run in parallel, overlapping their execution times.
- The summary report captures the actual wall-clock time from start to finish of all executions.
Example
Individual Journeys:
- Journey A: Total Duration 00:05:30 (including queued and throttled time)
- Journey B: Total Duration 00:04:45 (including queued and throttled time)
Summary Report:
- 2 of 2 executions in 00:06:15
In this example, the summary report shows a shorter overall time because the journeys partially ran in parallel.