# Test step events
When interacting with a webpage, usually there are events happening behind the scenes, such as network requests (e.g., a button click triggers a network request to fetch the data that is needed by the page), or console logs (e.g., warning or error messages).
Test steps with events associated with them will show an indicator in the steps list. Either clicking on the indicator or opening the steps details panel and then clicking on Events will take you to the events tab for that step.
Note that you can see the test step events either through the execution report (e.g., specific job report) or the goal view (where you edit your journeys). If the latter, the events will be related to the execution of the goal version you are seeing at that moment.
About live authoring
During live authoring, you can open the devtools of the interactive preview browser and see all the network traffic and the console logs there, see Advanced mode & DevTools for more information.
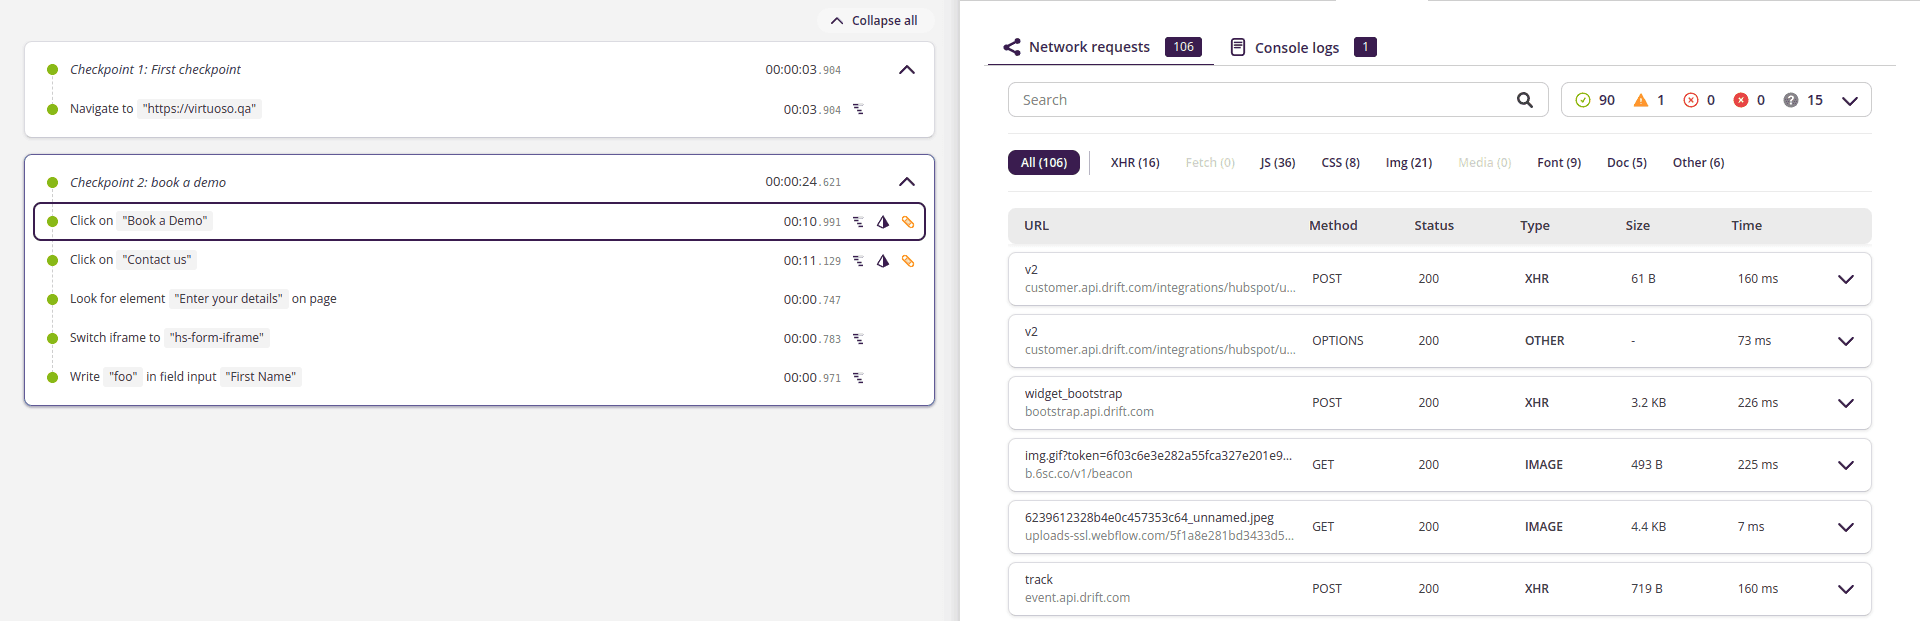
# Network requests
Here you will see any network request that finished during the execution of the test step.
In the top part, you can find some filters to fine-tune the results shown (useful when you have hundred of requests to review). You can do a free search, filter by status (e.g., select only Client errors to filter network requests with a status code in the range of 4XX), and filter by type (e.g., only XHR requests, usually representing API calls).
At the bottom, you can see the list of network requests. Clicking on each of its columns will sort the results by that property.
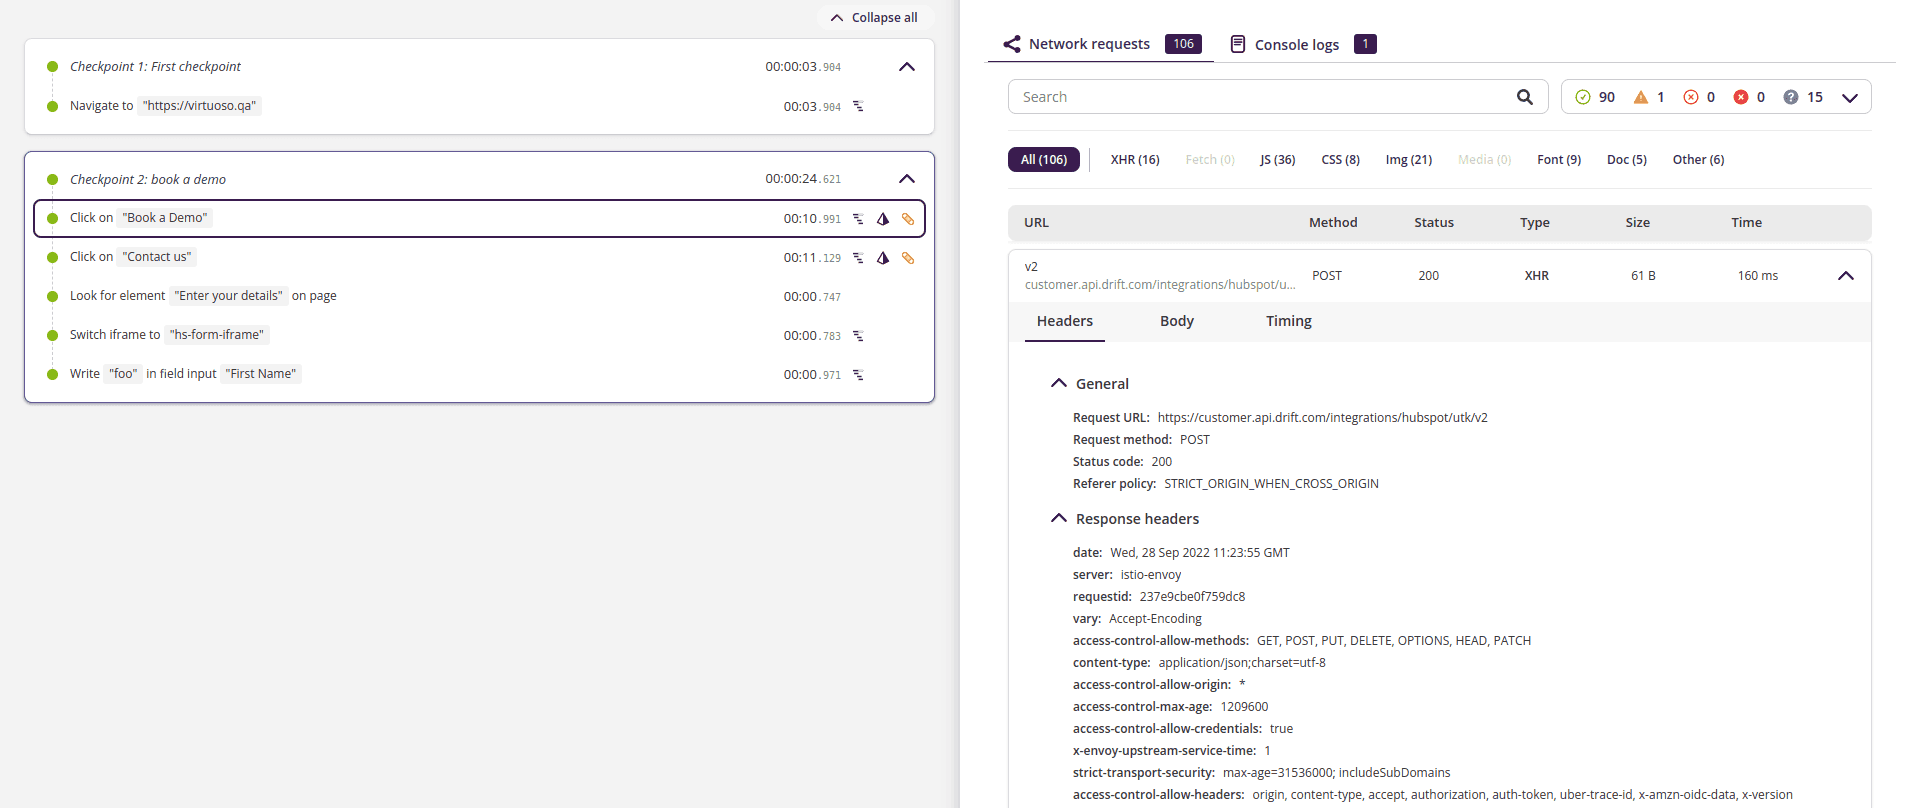
# Network request details
If you want to know more about a specific entry in the table click on it to expand its details. Here you will find the Headers, the Body (only when the response included a body), the Timing, and the Cookies (not always available if not dealing with cookies).
- The
Headerswill show general information about the request itself as well as a detailed summary of the request and response headers (their keys and values), here you can see the request payload (if any); - The
Body, when available, will show the content of the response in a formatted way (e.g., the JSON response of your APIs would show here); - The
Timingwill give you a complete summary of the time that each stage of your request took (e.g., the DNS resolution, the waiting time, etc); - The
Cookies, when available, will show a table with the content of each of the cookies involved in the request showing all their details (domain, path, secure flag, etc).
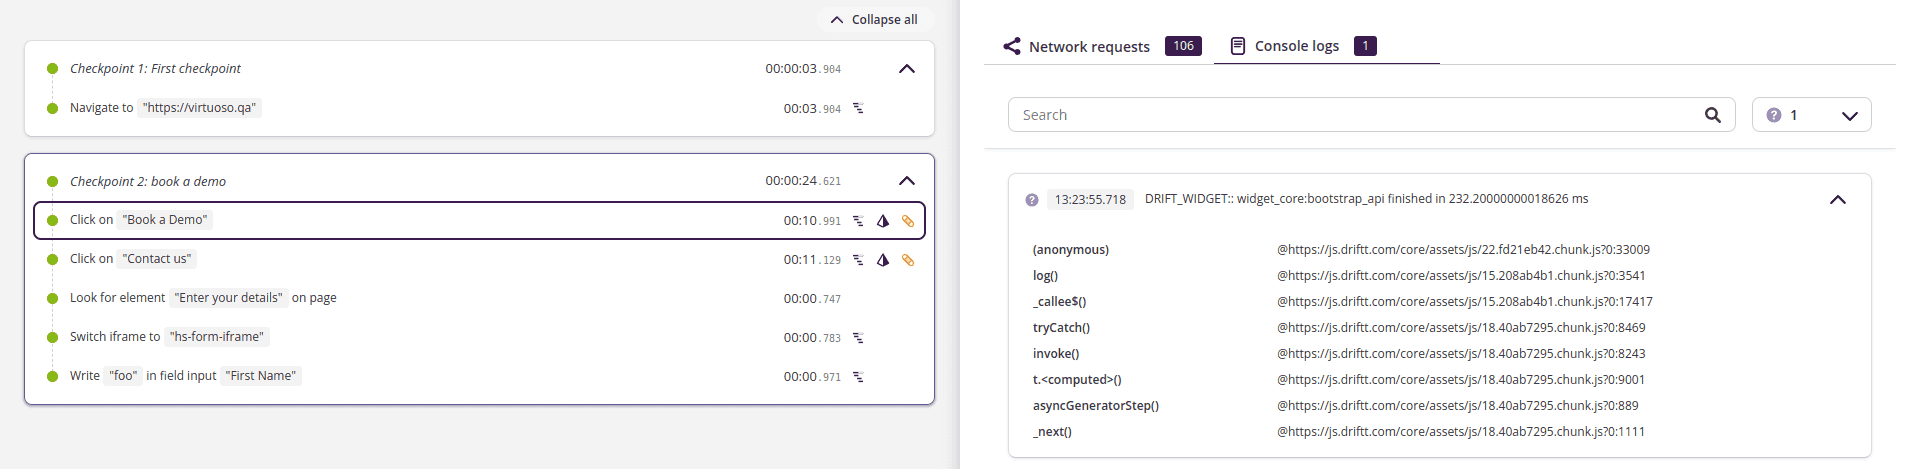
# Console logs
These are the entries that you would see if you open the testing application browser and you open then the console of the browser. Virtuoso will show all the console log entries and will represent them with different styles according to their severity level (e.g., warning, error, etc).
To see the full content of a log just click on it and it will expand showing to you all the details.